
Costs to Play Trends
Financial costs to play sports divide American families. Where children play, with whom and what experiences they take from sports can be impacted by affordability. The trends below come from the Aspen Institute’s State of Play 2022 report, courtesy of data collected or analyzed by the Project Play team or articles and research produced by other entities.
Top 5 Costs to Play Trends
1
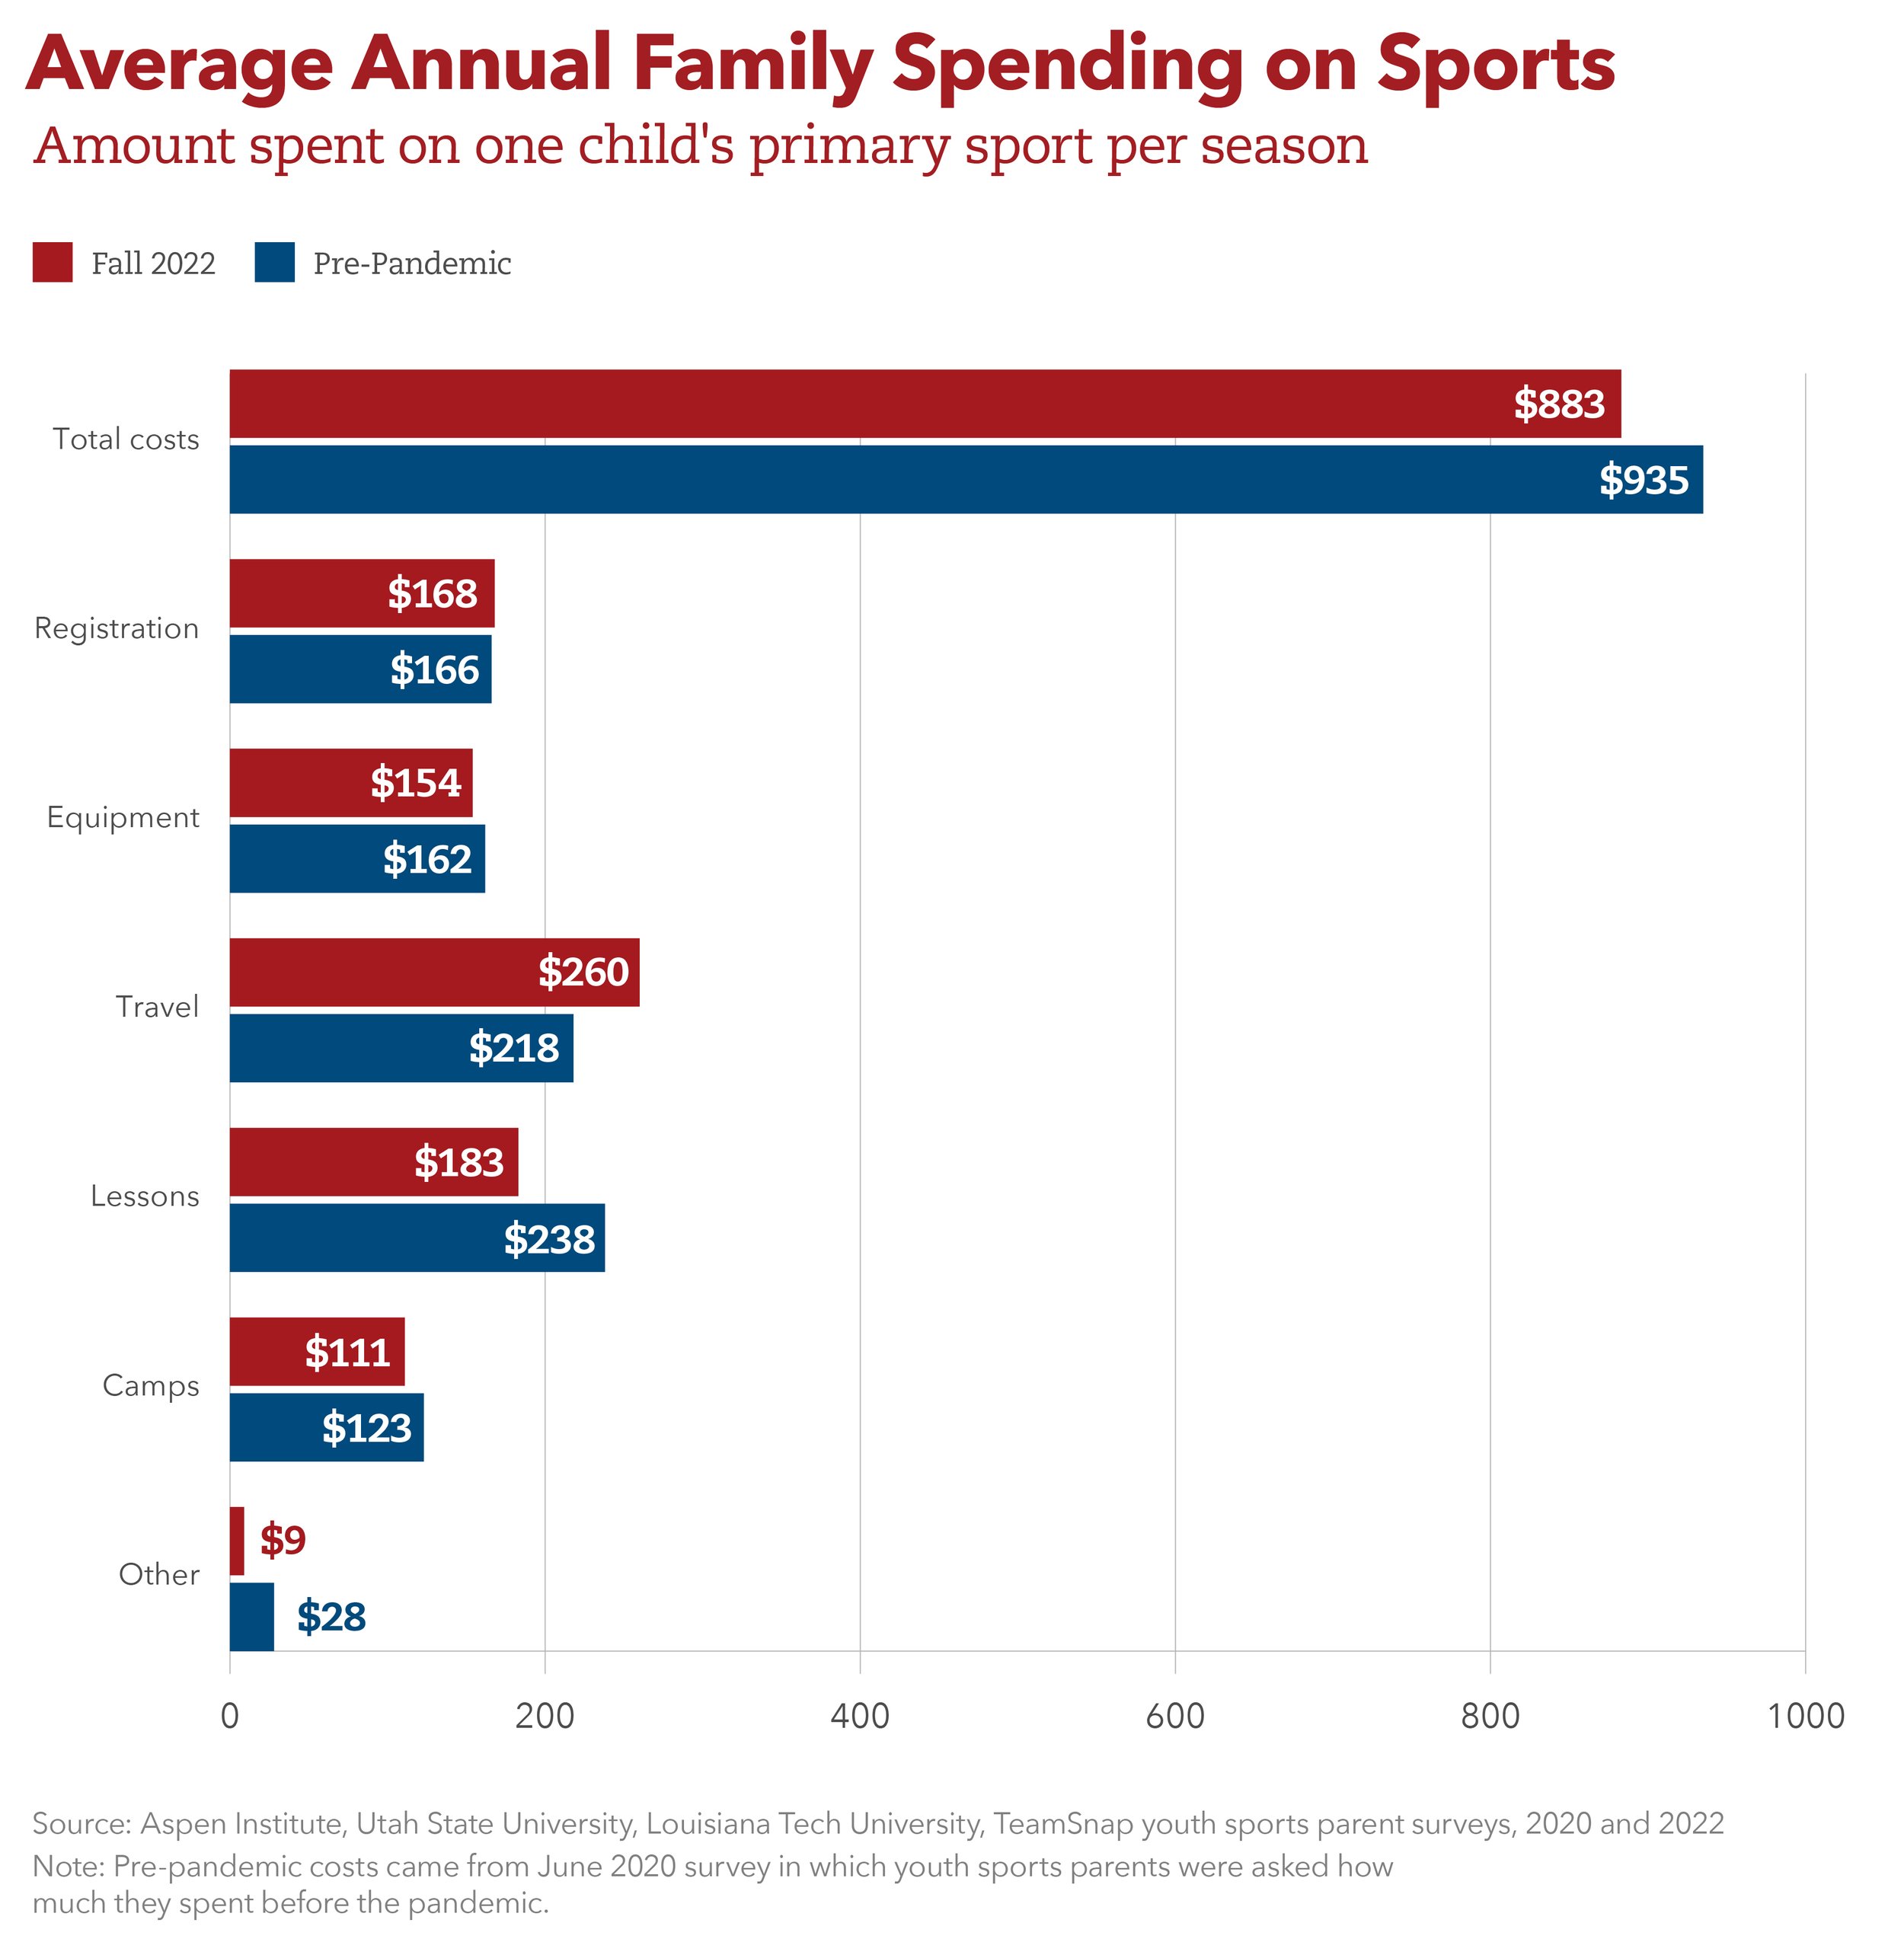
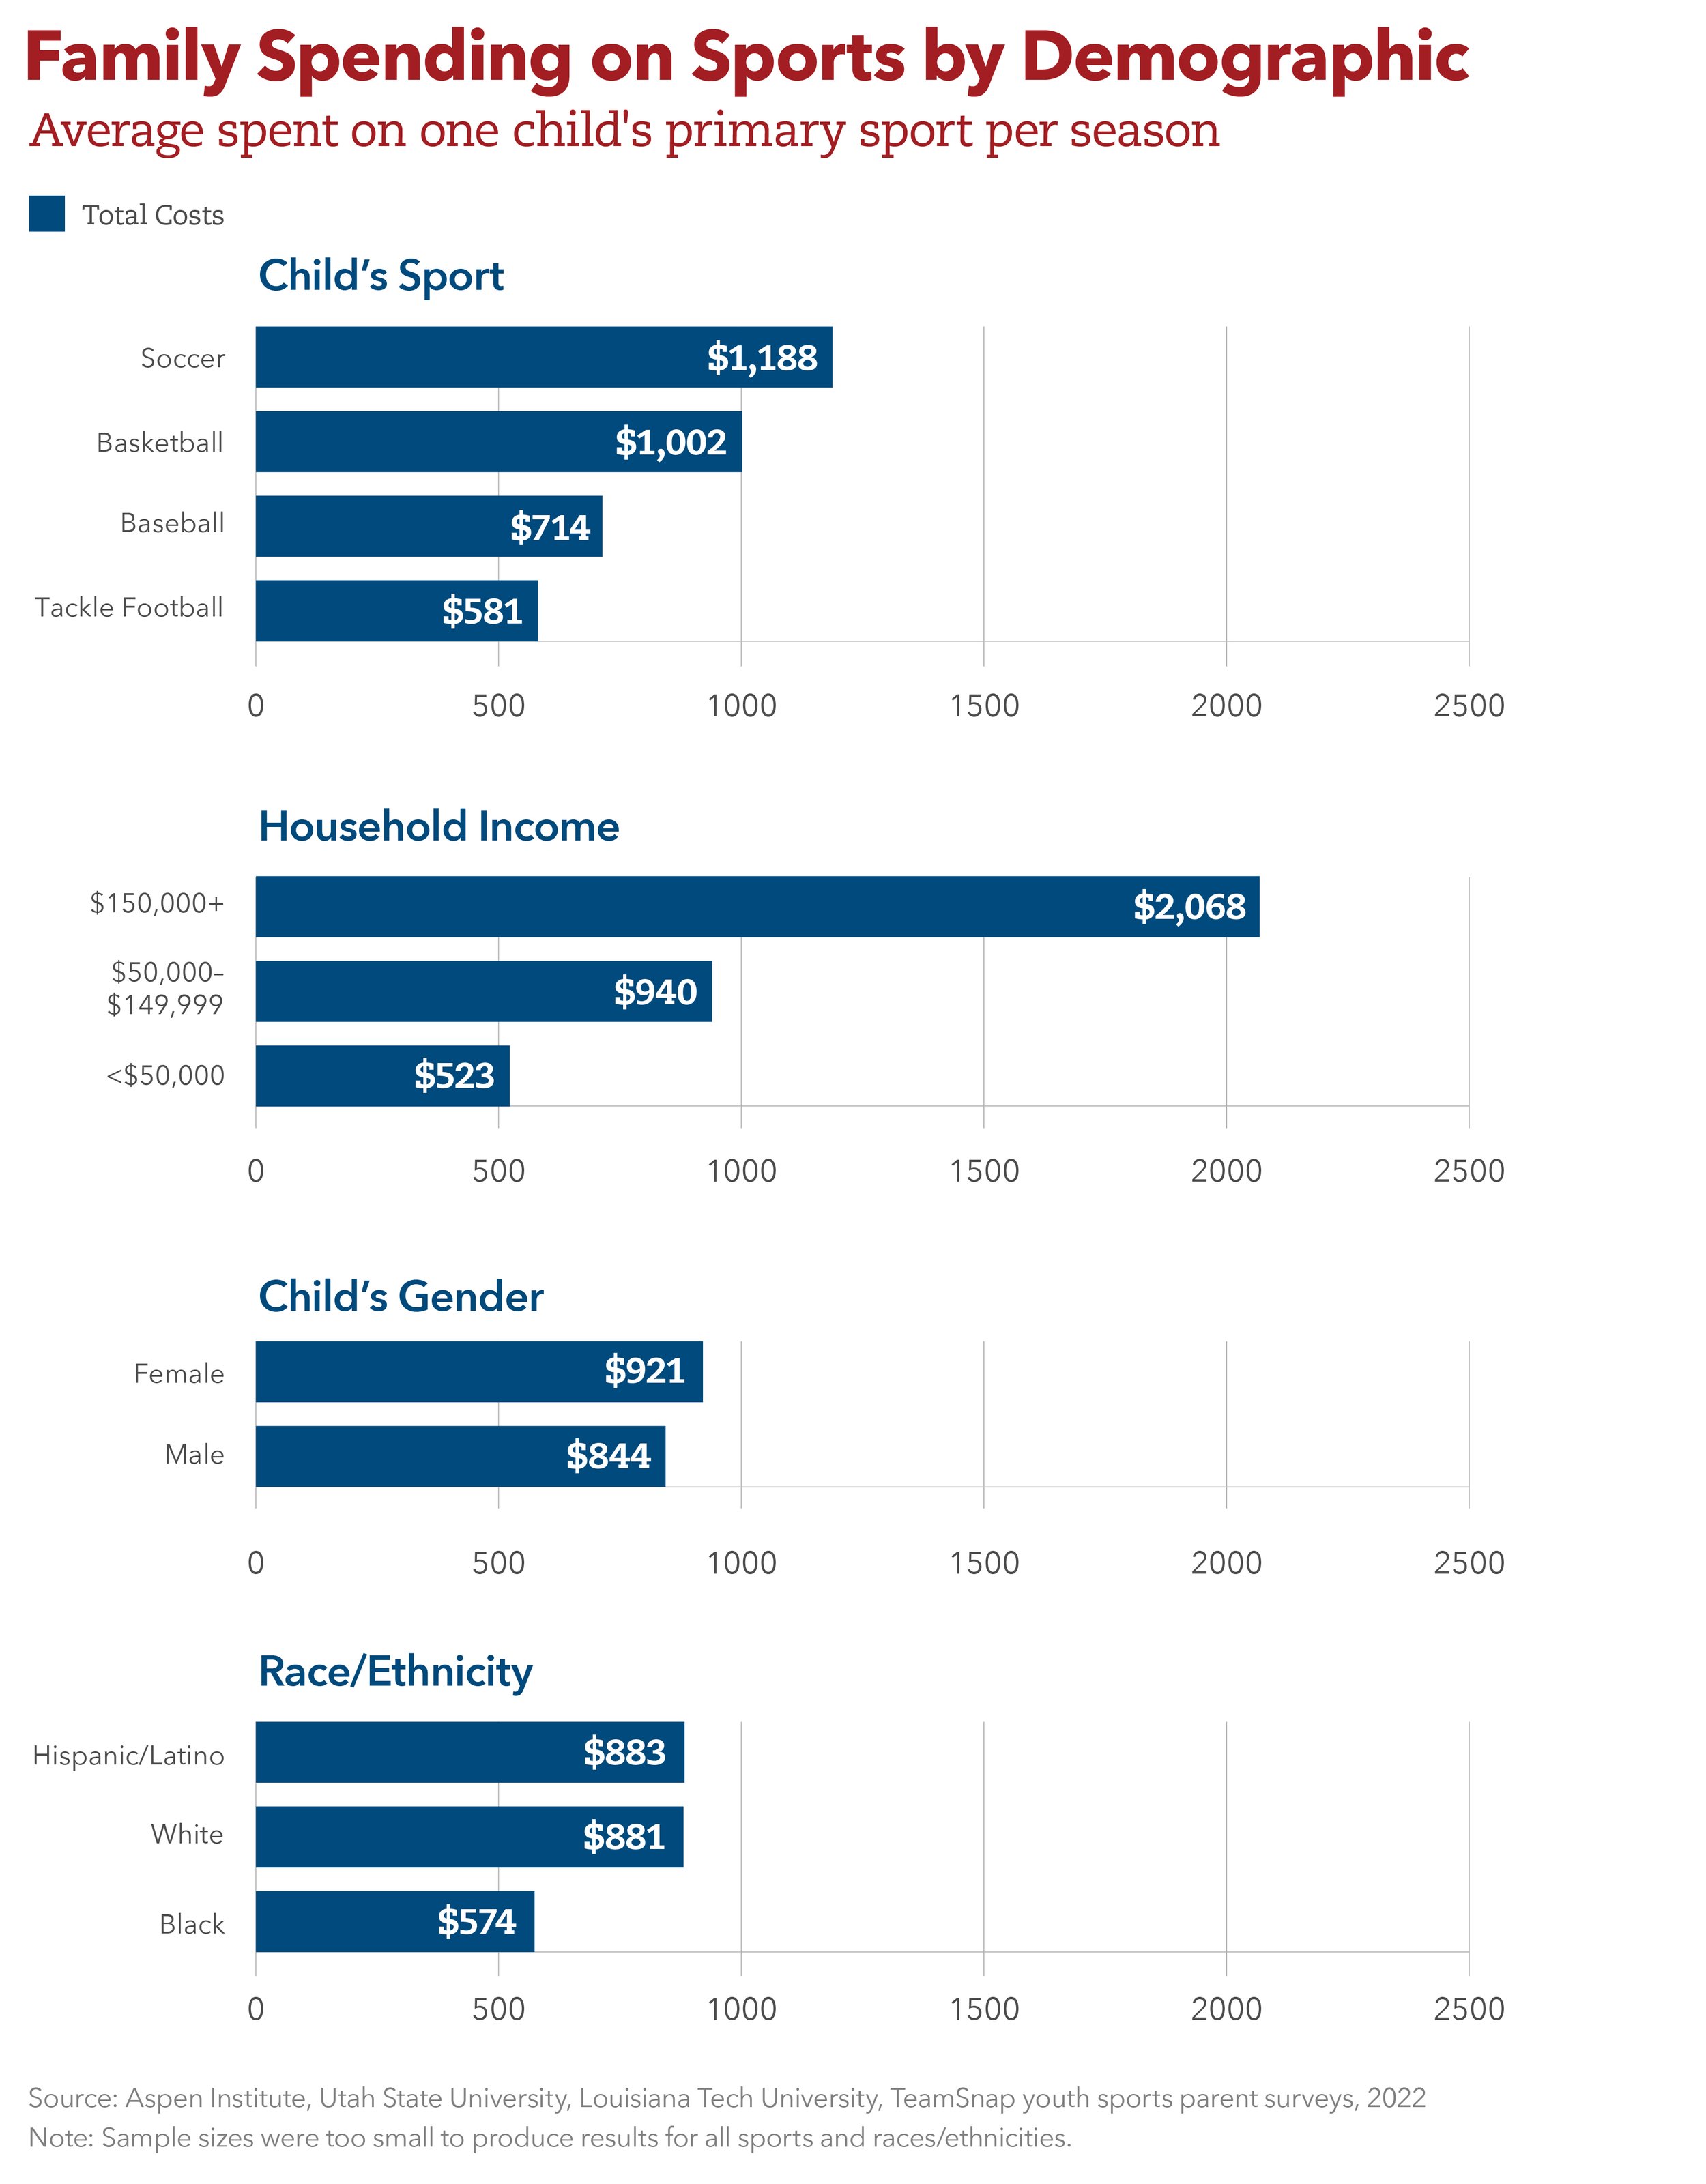
The average family pays $883 annually in one child’s primary sport. That’s down 6% from pre-pandemic costs previously reported by parents. Travel costs to play sports increased 19% in Fall 2022 compared to before COVID-19 while the amount spent on individual lessons declined 23%, according to the Aspen Institute’s latest youth sports parent survey, in partnership with Utah State University, Louisiana Tech University and TeamSnap. Registration fees and equipment/uniform costs stayed relatively flat over the three years.
Parents in the wealthiest households spent about four times more on their child’s sport than the lowest-income families. The middle-income families were far closer in their spending to the lowest-income households than the wealthiest. Parents making $150,000 or more spent 83% more on travel for their child’s sports experience than families earning under $50,000, and 65% more than households making between $50,000 and $149,999. The wealthiest families were almost twice as likely to report they spent a little or substantially more on sports during the past year than the lowest-income households. Bottom line: Children in the U.S. are still having different sports experiences based on money.
2
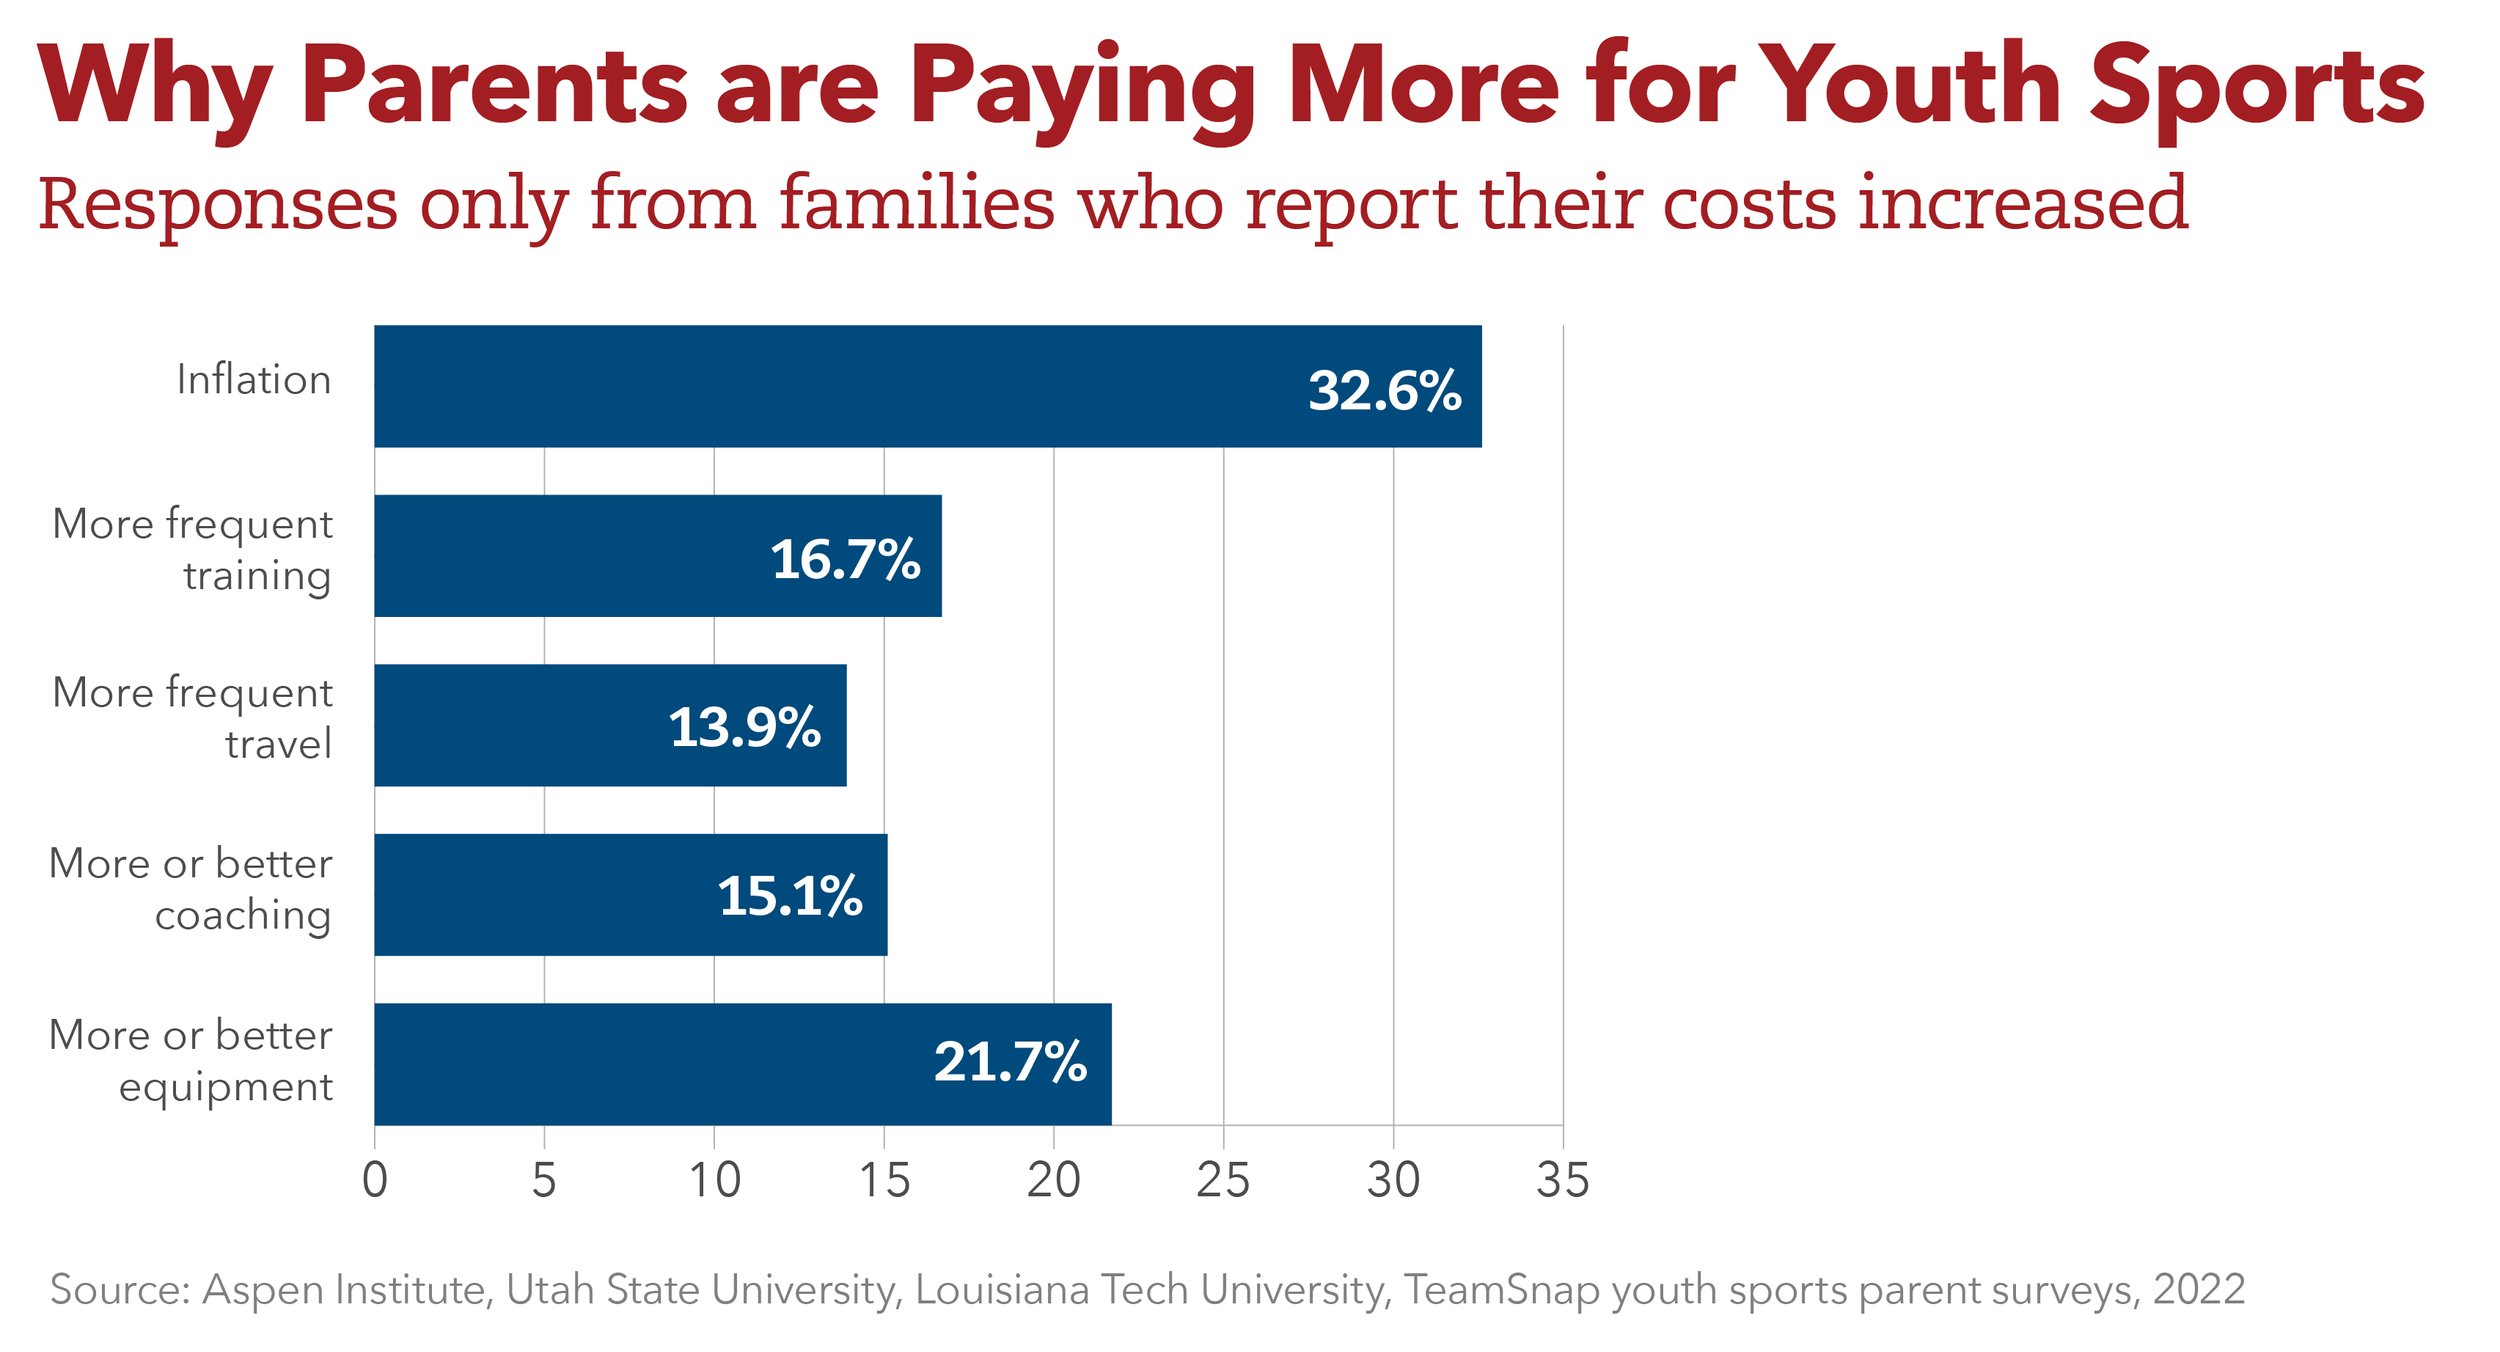
Inflation is on the minds of youth sports parents. In our latest survey, 1 in 3 U.S. parents whose sports expenses increased since 2021 cited inflation as the No. 1 reason. Other factors included buying more or better equipment, electing for more frequent training, paying for more or better coaching, and costs associated with more frequent travel. Some families are reducing the number of seasons, leagues or sports their child play in a given year, while sports providers search for creative ways to keep prices down and participation up. The annual inflation rate for the 12 months ending in September 2022 was 8.2%.
"The inflation issue is very real and concerning. People are still buying sports products. But at some point, when people see prices change, they may make discretionary choices and sports come into play. The last thing you want to do is cut your kids, but at some point you have to.”
— Tom Cove, CEO, Sports & Fitness Industry Association
More than half of Americans are considering taking on extra jobs to be able to pay for everyday expenses and meet the rising cost of living as inflation remains high, according to a study by Qualtrics. The United States could be headed to a recession. The last time that happened, team sports participation declined from 45% in 2008 to 37% in 2016. Municipalities and philanthropy invested less money into parks and recreation departments and community leagues during that period, sending more children into the more competitive and expensive travel sports model.
$30-40B
Estimated annual money spent by families in the U.S. on their children's sports activities, based on the Aspen Institute's analysis of parent survey data.
The youth sports industry is much larger and harder to calculate, and includes spending by government, philanthropy and the private sector. In 2022, Sportico predicted that the industry’s fragmented nature makes it ripe for consolidation by private equity investors.
3
Black families spent less on sports than White and Hispanic/Latino parents. Our latest parent survey results from Fall 2022 showed Black parents spent $574 annually on one child’s primary sport, less than parents who are Hispanic/Latino ($883) and White ($881). This finding was similar to our 2019 pre-pandemic parent survey showing Black parents spent $537 on sports, also less than other races and ethnicities. In the Fall 2022 survey, White parents reported spending about twice as much on registration fees and individualized lessons as Black parents. Hispanic/Latino parents spent the most on private lessons.
The results showed almost no difference on family spending based on a child’s gender. Parents with girls spent slightly more annually ($921) than parents of boys ($844) – a similar finding from our pre-pandemic survey in 2019. This doesn’t mean girls, broadly, are receiving equitable opportunities and access to sports. Nationally, 41% of boys ages 6-17 and 32% of girls played sports on a regular basis in 2021, according to Sports & Fitness Industry Association data. But the spending habits may suggest that when many girls do play sports, albeit at lower rates than boys, their parents invest slightly more money into the experience.
4
Parents spend more money on soccer and basketball. Our Fall 2022 parent survey had sample sizes large enough to evaluate the average annual cost for four sports – soccer ($1,188), basketball ($1,002), baseball ($714) and tackle football ($581). Tackle football was an outlier given that it's generally not a travel-based sport outside of the school setting.
Soccer, basketball and baseball all have pay-to-play models that impact access to sports. In our latest survey, parents most identified basketball as their child’s primary sport. More than one-third of parents said their child regularly played basketball in the past year.
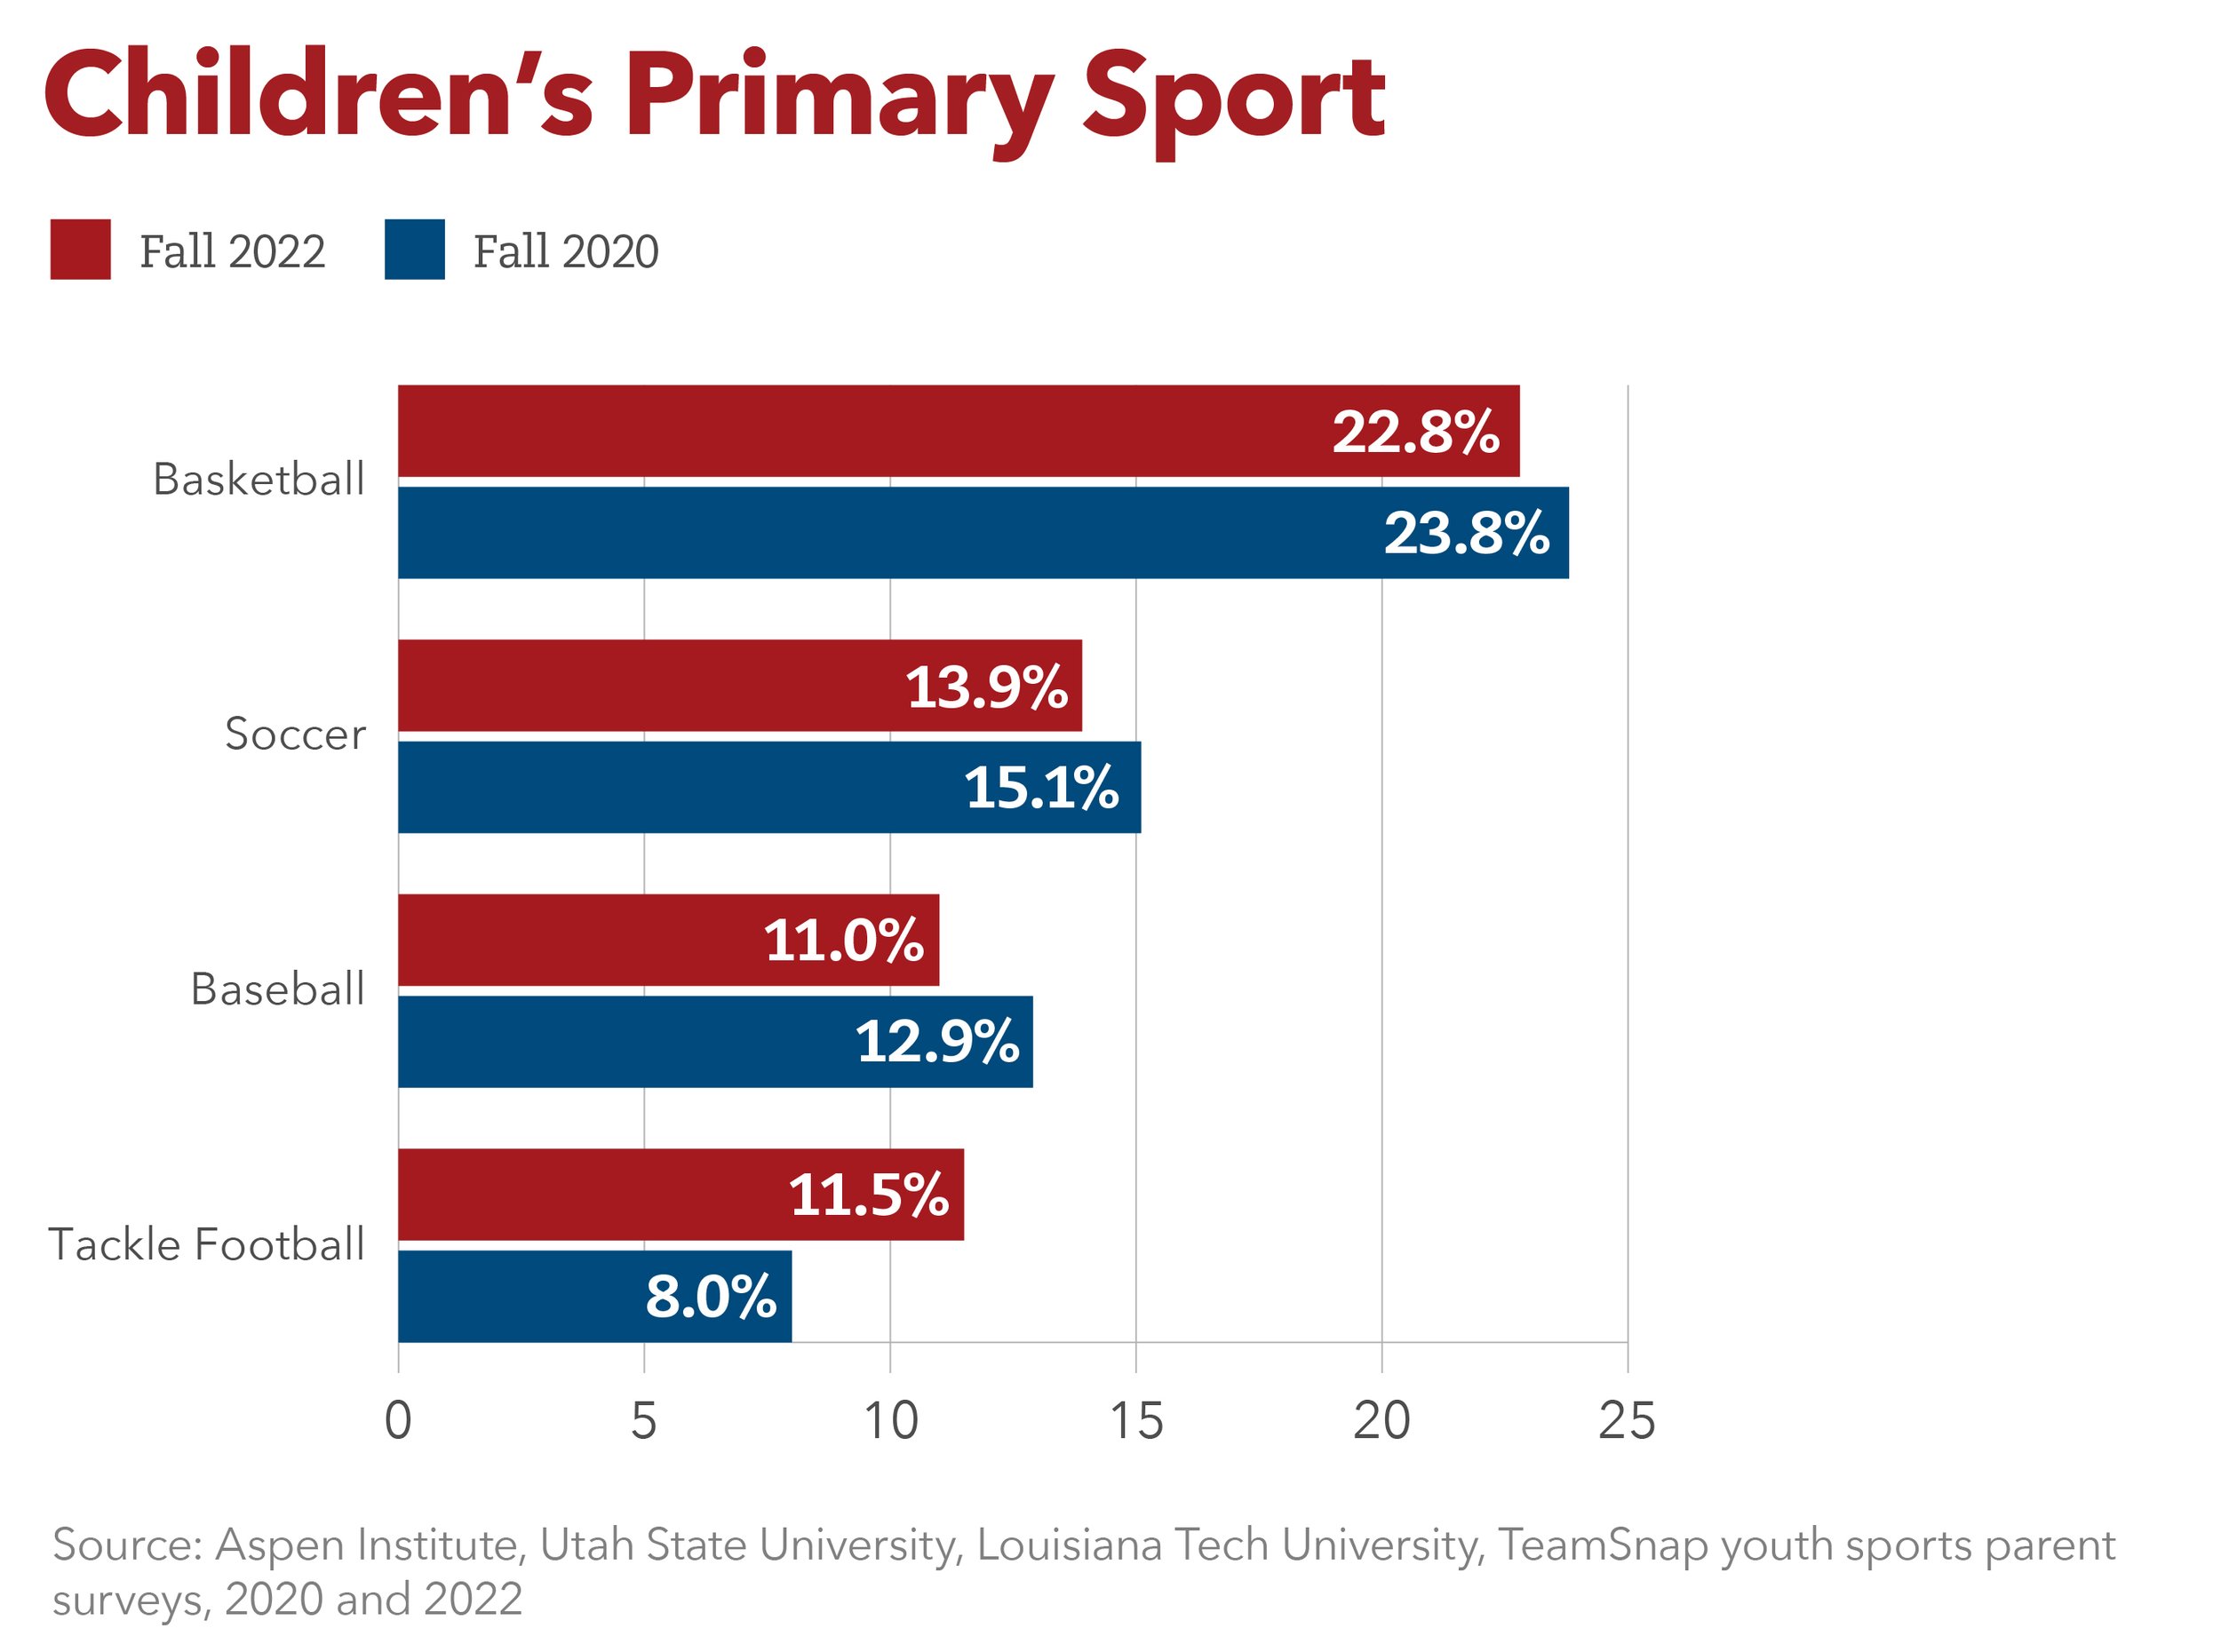
Basketball’s pathway through AAU – and associated costs plus small roster sizes – may be impacting girls. In 2021-22, basketball dropped to the fourth-most-popular girls sport by high school participation, according to the National Federation of State High School Associations. Girls’ basketball lost 19% of its players since 2002, while other top female sports grew, such as track and field (+10%), volleyball (+15%) and soccer (+27%). In some communities, girls have fewer opportunities to play recreational sports than boys. If AAU is not an option due to costs, travel or ability, many girls don’t get exposed to basketball to consider trying in high school.
5
Communities are tapping into new federal funds to support youth sports. Quietly in cities and counties across the country, federal funding from the American Rescue Plan Act (ARPA) is benefiting children’s sports teams and organizations. The Montville (Connecticut) Town Council spent $16,000 of its $5.5 million in APRA funds to help the local youth football program buy 200 new football helmets. The West Michigan Sports Commission submitted a request for $2 million of Kent County’s share of ARPA funding to expand a youth sports facility with more fields and amenities. A new $27 million youth sports complex in Lincoln, Nebraska, will receive $8.5 million in ARPA funds from the city of Lincoln and Lancaster County.
Perhaps the simplest and most impactful use of these funds: free sports for kids. The city of St. Paul, Minnesota dropped all sports fees for youth ages 9-18 over the next three years, thanks to ARPA funds. Registration for soccer and basketball was up nearly 40% without the fees, which previously ranged between $25 to $40. The three-year timeframe will give the St. Paul parks and recreation department runway to evaluate and create a better long-term solution, so fees potentially don’t have to return.
92%
Park and recreation agencies who charge registration fees for all of their youth sports offerings, according to the National Recreation and Parks Association.
Read all State of Play 2022 costs to play charts here.
Research Sources
National Youth Sports Parent Survey – Aspen Institute, Utah State University, Louisiana Tech University, TeamSnap
Qualtrics
National Federation of State High School Associations (NFHS) Participation Survey
National Parks and Recreation Association (NRPA)