

cost
JOIN #PROJECTPLAY
The average child today spends less than three years playing a sport, quitting by age 11, according to a 2019 survey by Project Play with the Utah State University’s Families in Sports Lab. To keep them in the game, many parents are opening their checkbooks. In 2022, the average youth sports parent spent $883 on one child’s primary sport per season, according to a survey by Project Play and Utah State. The annual survey by the Sports & Fitness Industry Association (SFIA) in 2021 found that 24% of kids ages 6 to 12 from homes with $25,000 or less played sports on a regular basis, compared to 40% of kids from $100,000+ homes (State of Play 2022 report).
Click to enlarge
Americans say youth sports deserves public funding. More than half of U.S. adults (52%) say such support for sports would have the most impact at the youth and school sports levels, according to a survey commissioned by the Commission on the State of U.S. Olympics and Paralympics. Far fewer adults identified the Olympics (14%), Paralympic Games (7%), college sports (6%) and professional leagues (5%) as deserving of taxpayer support (State of Play 2023 report).
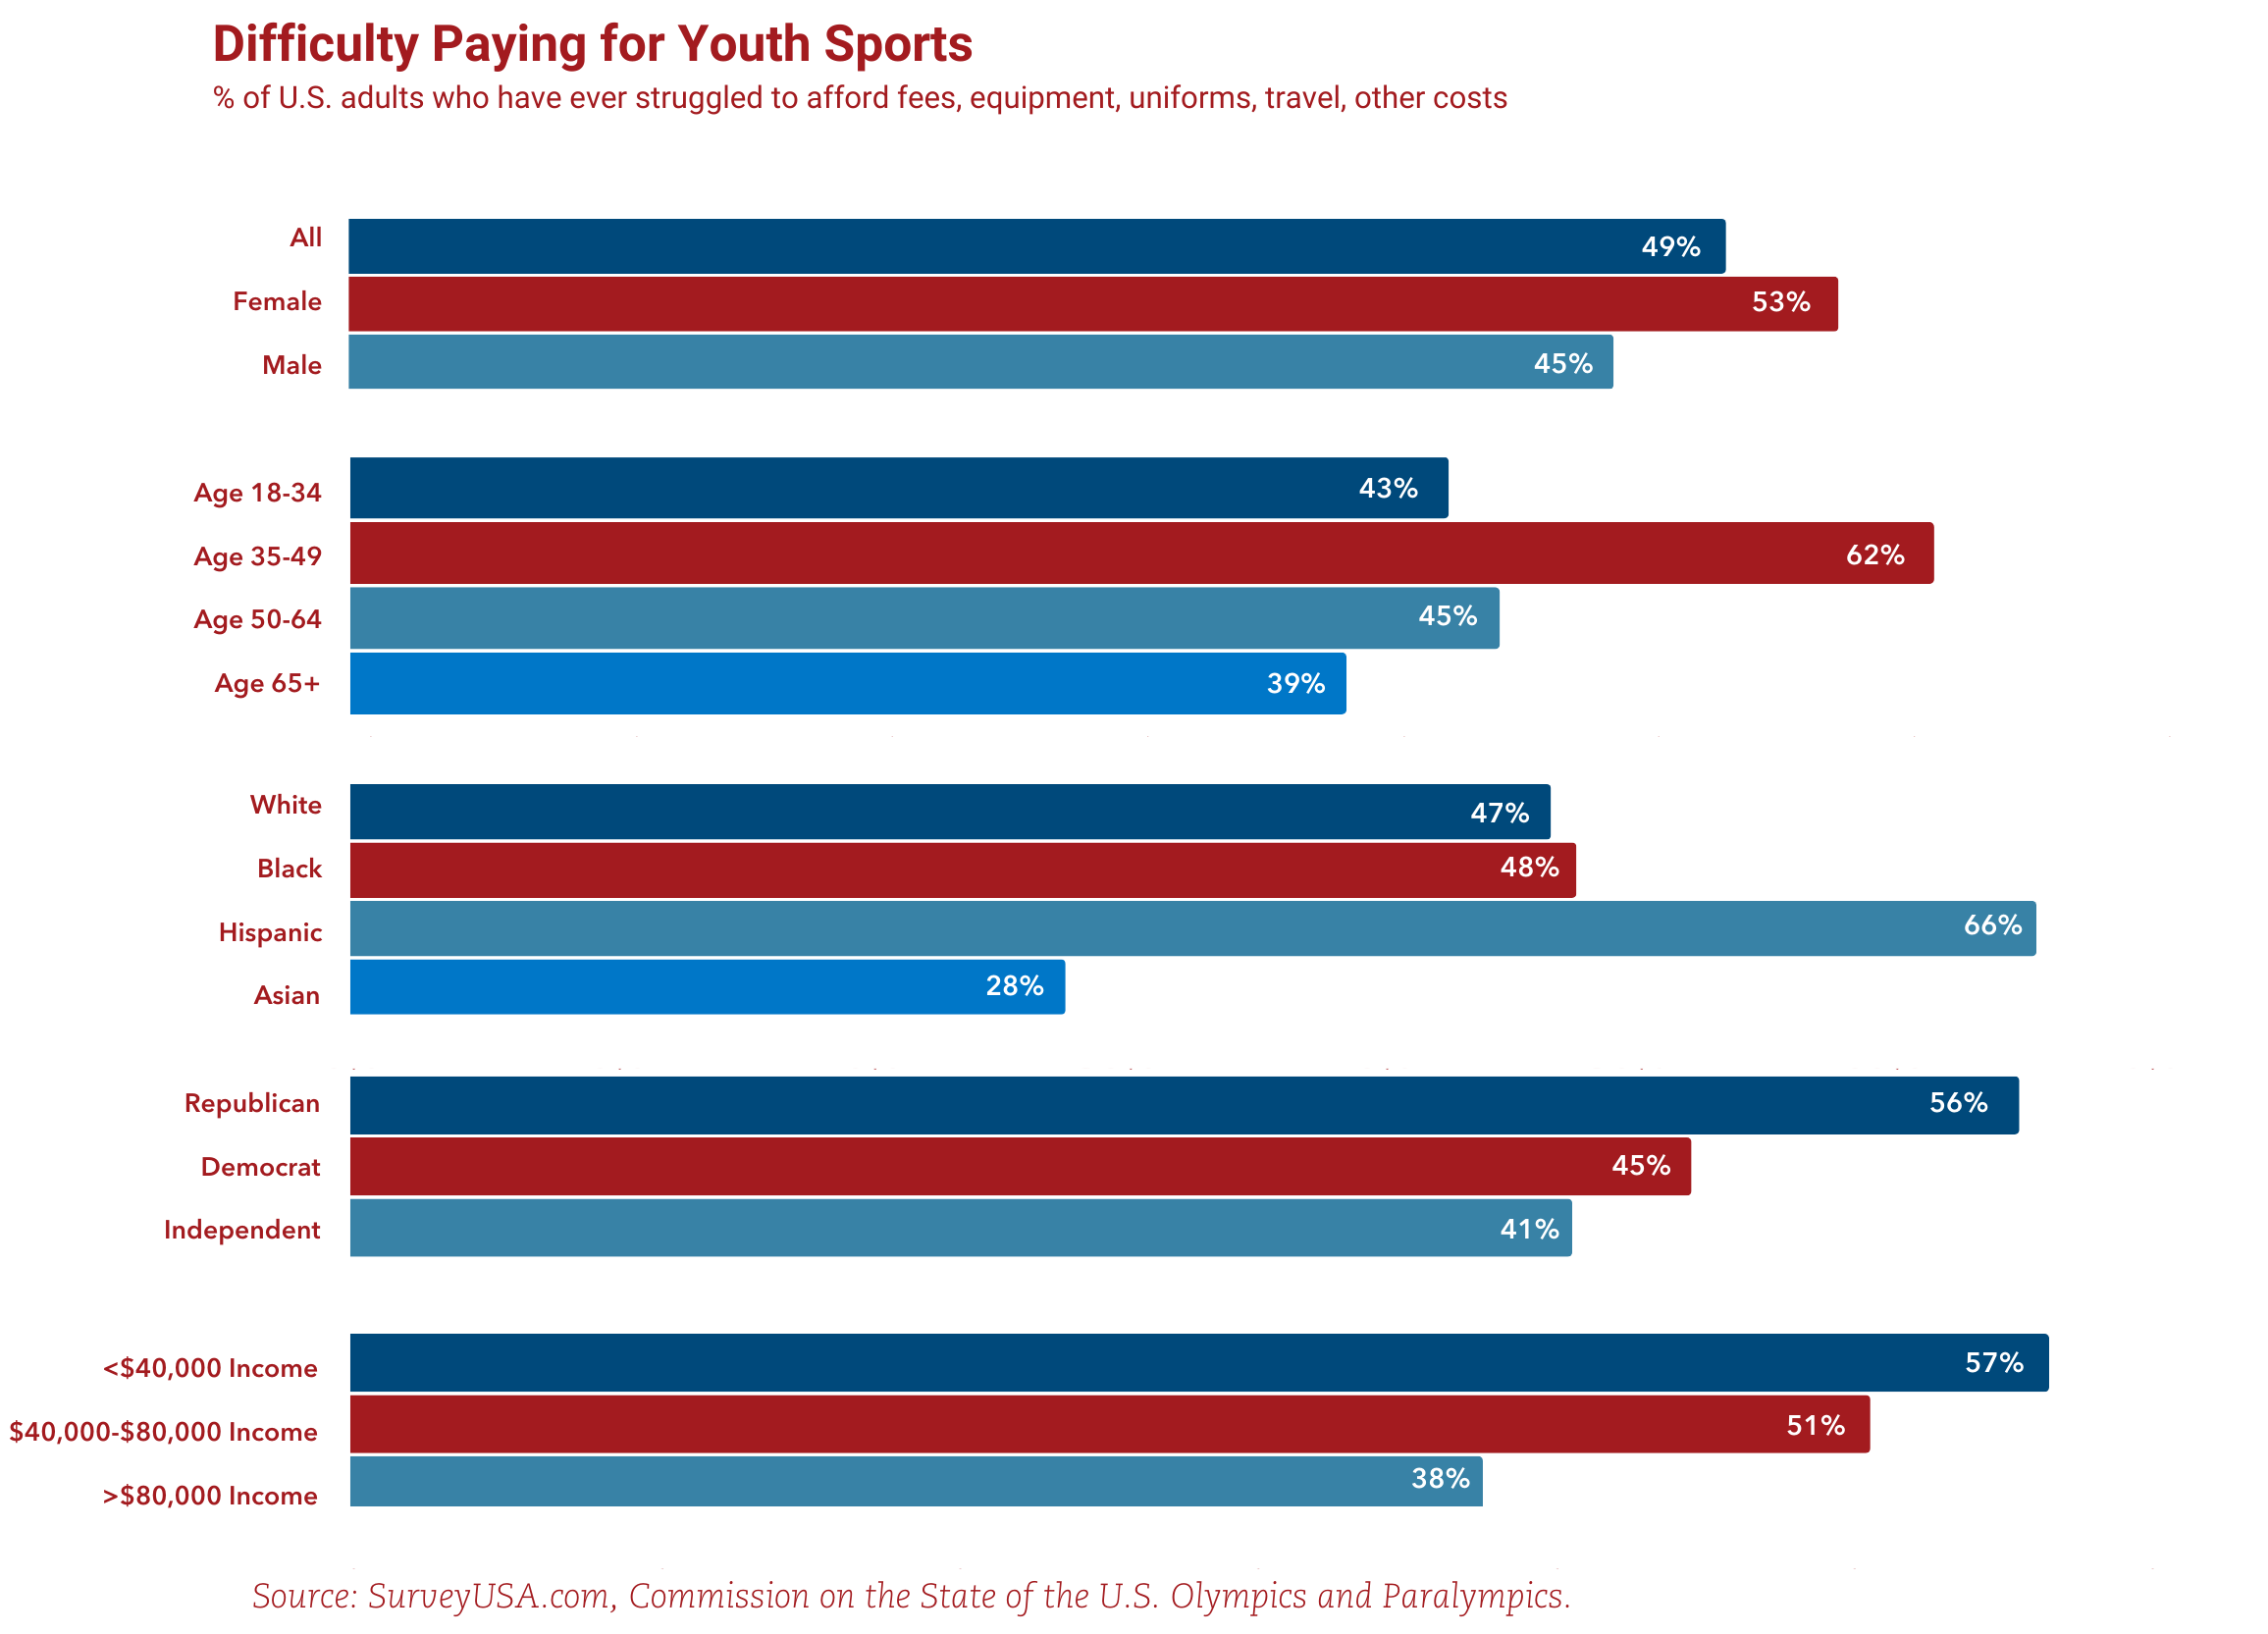
Half of survey respondents who played youth sports or who have children who have played said they have struggled to afford the costs to participate. The issue impacts a broad swath of Americans of all backgrounds, including 66% who are Latino/a, 62% of 35-49-year-olds, 58% of those with high school educations, 57% of lower-income adults, and 56% of both Republicans and those who rent their homes. More than 4 in 5 Americans say sports should be more accessible to those in underserved communities, as well as for athletes with physical disabilities.
Families had fewer options to play sports coming out of COVID-19. In 2021, 13% of youth sports parents indicated their community-based sports provider closed due to COVID-19, and another 12% said it merged with another organization (State of Play 2021 report). In total, more than four of 10 families said their community-based sports provider either closed, merged or returned with limited capacity. By 2022, fewer community-based teams and organizations had closed in the previous year (State of Play 2022 report). Still, 3 of 10 youth sports parents said their child’s community program had either closed, merged or existed with less capacity than a year earlier.
click to enlarge
Children are having different sports experiences based on money. Parents in the wealthiest households spent about four times more on their child’s sport than the lowest-income families (State of Play 2022 report). Parents making $150,000 or more spent 83% more on travel for their child’s experience than families earning under $50,000, and 65% more than households making between $50,000 and $149,999. The wealthiest families were almost twice as likely to report they spent a little or substantially more on sports during the past year than the lowest-income households.
For some sports, average annual costs are over $1,000 – and can balloon well into five figures. Of the four major sports, parents spend more money on soccer ($1,188 average cost) and basketball ($1,002) than baseball ($714) and tackle football ($581). Soccer, basketball and baseball all have pay-to-play models that impact access to sports. Tackle football is an outlier given that it’s not a club model.
Travel is now the costliest feature in youth sports. On average across all sports, parents spent more annually on travel ($260 per sport, per child) than equipment ($154), private lessons ($183), registration fees ($168), and camps ($111). That average includes all kids playing sports, not just those on travel teams, which often start in grade school and can cost families far more than a couple hundred dollars a year.
In our State of Play Kansas City report from 2024, surveyed children from low-income households were three times less likely to play on traveling teams than those from high-income homes. Low-income children were less likely to “almost always” or “frequently” have fun in sports (56%) than high-income youth were (72%).
click to enlarge
Inflation is on the minds of youth sports parents. In our latest 2022 survey, 1 in 3 U.S. parents whose sports expenses increased during the previous year cited inflation as the No. 1 reason. Some families are reducing the number of seasons, leagues or sports their child play in a given year. The annual inflation rate for the 12 months ending in September 2022 was 8.2%.
The Aspen Institute estimated U.S. families spend $30 to $40 billion annually on their children’s sports activities. This is based on Aspen’s analysis of parent survey and national sport participation data. That’s more than the annual revenues of any professional league. The youth sports industry as a whole is much harder to calculate, and includes spending by government, philanthropy and the private sector.
click to enlarge
Equity
There's a relative lack of access for children of color. In 2023, 41% of White youth ages 6-17 regularly played sports, higher than Hispanic (37%) and Black (35%) youth, according to the Sports & Fitness Industry Association. Black children are playing sports less than they once did, while Hispanic participation is increasing. In 2013, 45% of Black children played sports, a higher rate than White peers.
In the latest SFIA data, regular sports participation by Hispanic children ages 6-12 increased 14% from 2022 to 2023, the highest since 2016. But challenges remain, especially in communities with many first-generation immigrants and in certain areas of the country. In California, just 24% of Latino/a youth played sports four times a week, half the rate of White youth, according to a report by the LA84 Foundation. Often, Latino/a children quit sports for family responsibilities.
In Oakland, California, White children are three times more likely than Latino/a youth and two times more likely than Black and Asian kids to play sports on a recreation center team (State of Play Oakland). Access to quality parks in Oakland is unevenly distributed. Residents in Oakland neighborhoods where people most identify as a person of color have access to 66% less park space per person than those in predominantly White neighborhoods (Oakland Parks and Recreation Foundation, 2018). The city’s higher income neighborhoods were more likely to receive “A” and “B” maintenance scores, while the “D” and “F” parks were generally located in economically disadvantaged or gentrifying neighborhoods.
Data on other historically marginalized groups such as Native-American children are not even reported in government-funded studies that track physical activity in youth (University of Florida's SPARC, 2014). In the Native American community of San Felipe Pueblo, N.M, the only organized sport option is an after-school soccer program serving 250 of the 1,500 kids who live there and which is organized by a non-profit that addresses childhood obesity in tribal areas (Notah Begay III Foundation).
Many children of color were left behind during the pandemic. Nearly half of Hispanic youth (47%) resumed sports at a lower level than they were playing before the pandemic (Project Play/Utah State University, 2021). For Black youth, it’s 42%. The trend lines improved for Black children compared to earlier in the pandemic but remained worse than youth who are White (31% of whom resumed sports at a lower level). Black and Hispanic parents expressed the most fear of themselves or their child getting sick through sports during the pandemic. Asian high school students reported resuming sports during COVID-19 at lower rates than those of other races and ethnicities (Project Play/Resonant Education, 2021).
Play spaces are barriers for different children. In Harlem, where 47% of the youth are below the federal poverty level, the top three sports that Latino children say they want to try (skateboarding, fencing and ice hockey) are not widely available to them (State of Play: Harlem, 2018). Play space is one of the largest barriers for local leagues in Harlem, as many fields are occupied by programs that aren’t serving local residents. There are also transportation barriers that limits who can reach the Randall’s Island sports complex’s 60 new athletic facilities. Research also shows that Latinos are being left behind in the U.S. pay-to-play soccer model.
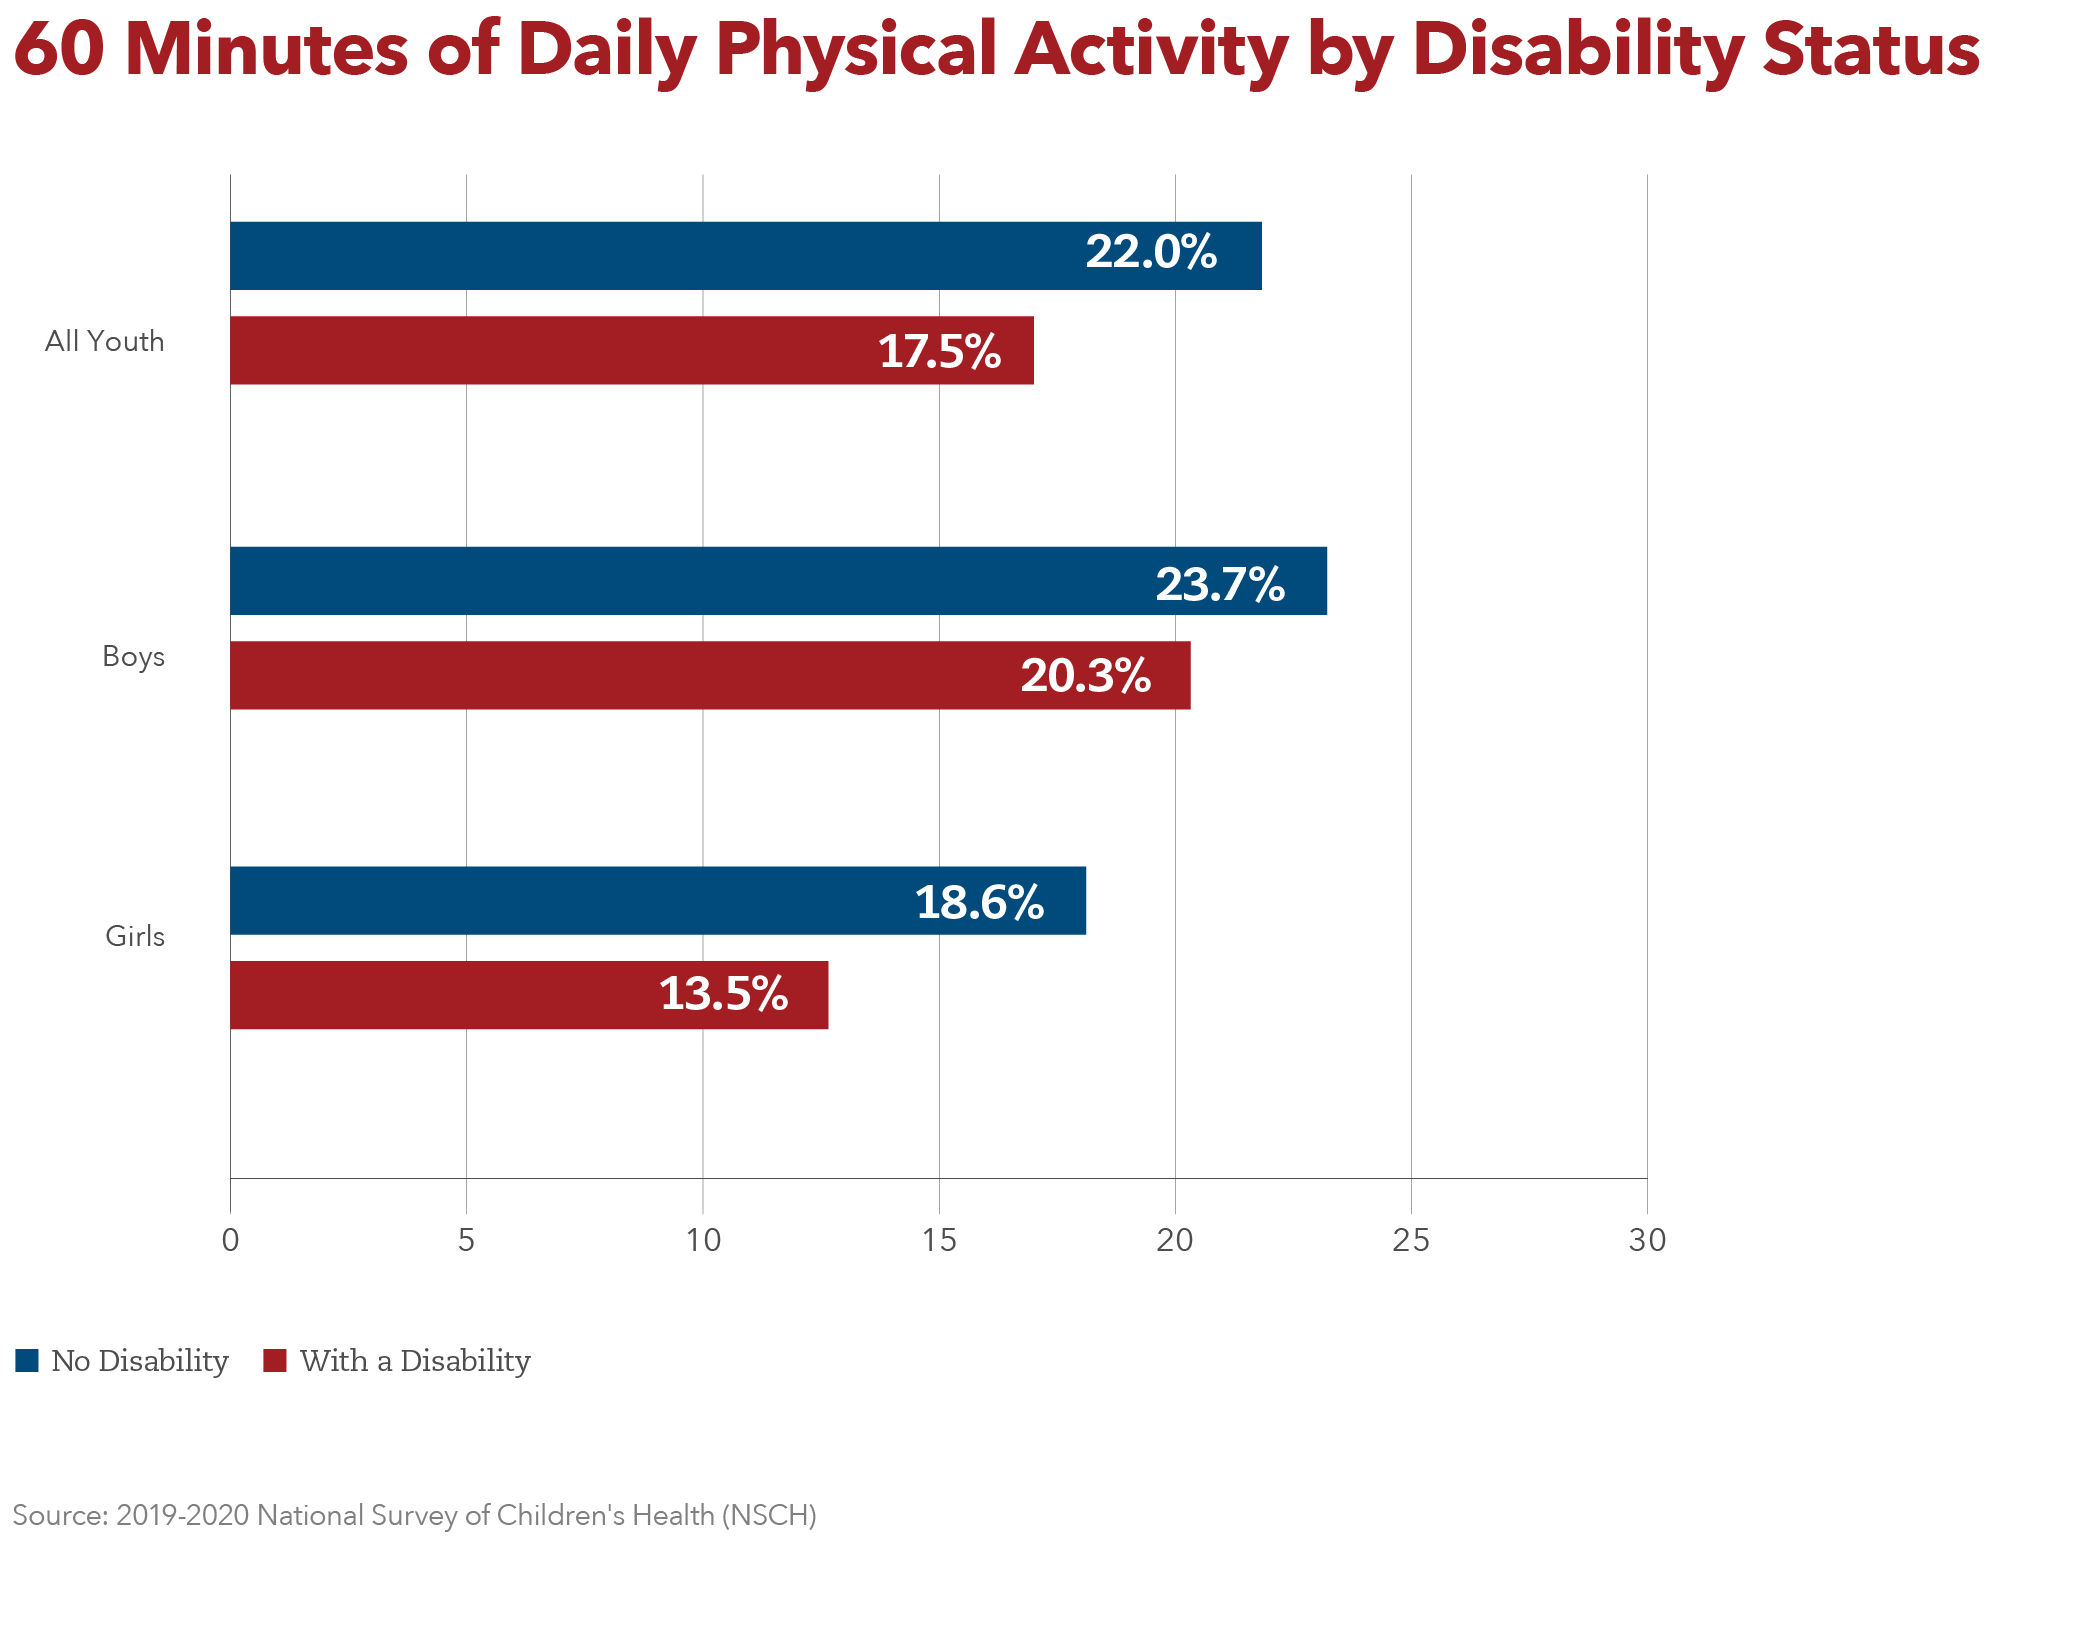
Youth with disabilities still struggle for access, despite growth in sport options driven in part due to anti-discrimination laws. Just 18% of youth with disabilities participate in 60 minutes of daily physical activity, less than the 22% rate for the general population (National Survey of Children’s Health, 2019-20). Only 14% of youth with an intellectual disability, 16% with cerebral palsy and 18% on the autism spectrum meet physical activity guidelines. In high schools, Unified Sports (joining people with and without intellectual disabilities on the same team) exploded in 2021-22 with 48,000 participants in 15 sports within 20 states, compared to 5,500 participants in three sports within 10 states in 2018-19 (National Federation of State High School Associations). However, adapted sports participation (allowing modified rules for people with disabilities) declined 51% over three years, dropping to 7,700 high school students in 2021-22. In Central Ohio, youth coaches said children with disabilities face the greatest need for more sports access (State of Play Central Ohio, 2021). About one-third of Alabama families who have a child with a disability reported it’s “very hard” to obtain recreational opportunities, according to the Alabama Department of Public Health (State of Play Mobile County, 2018).
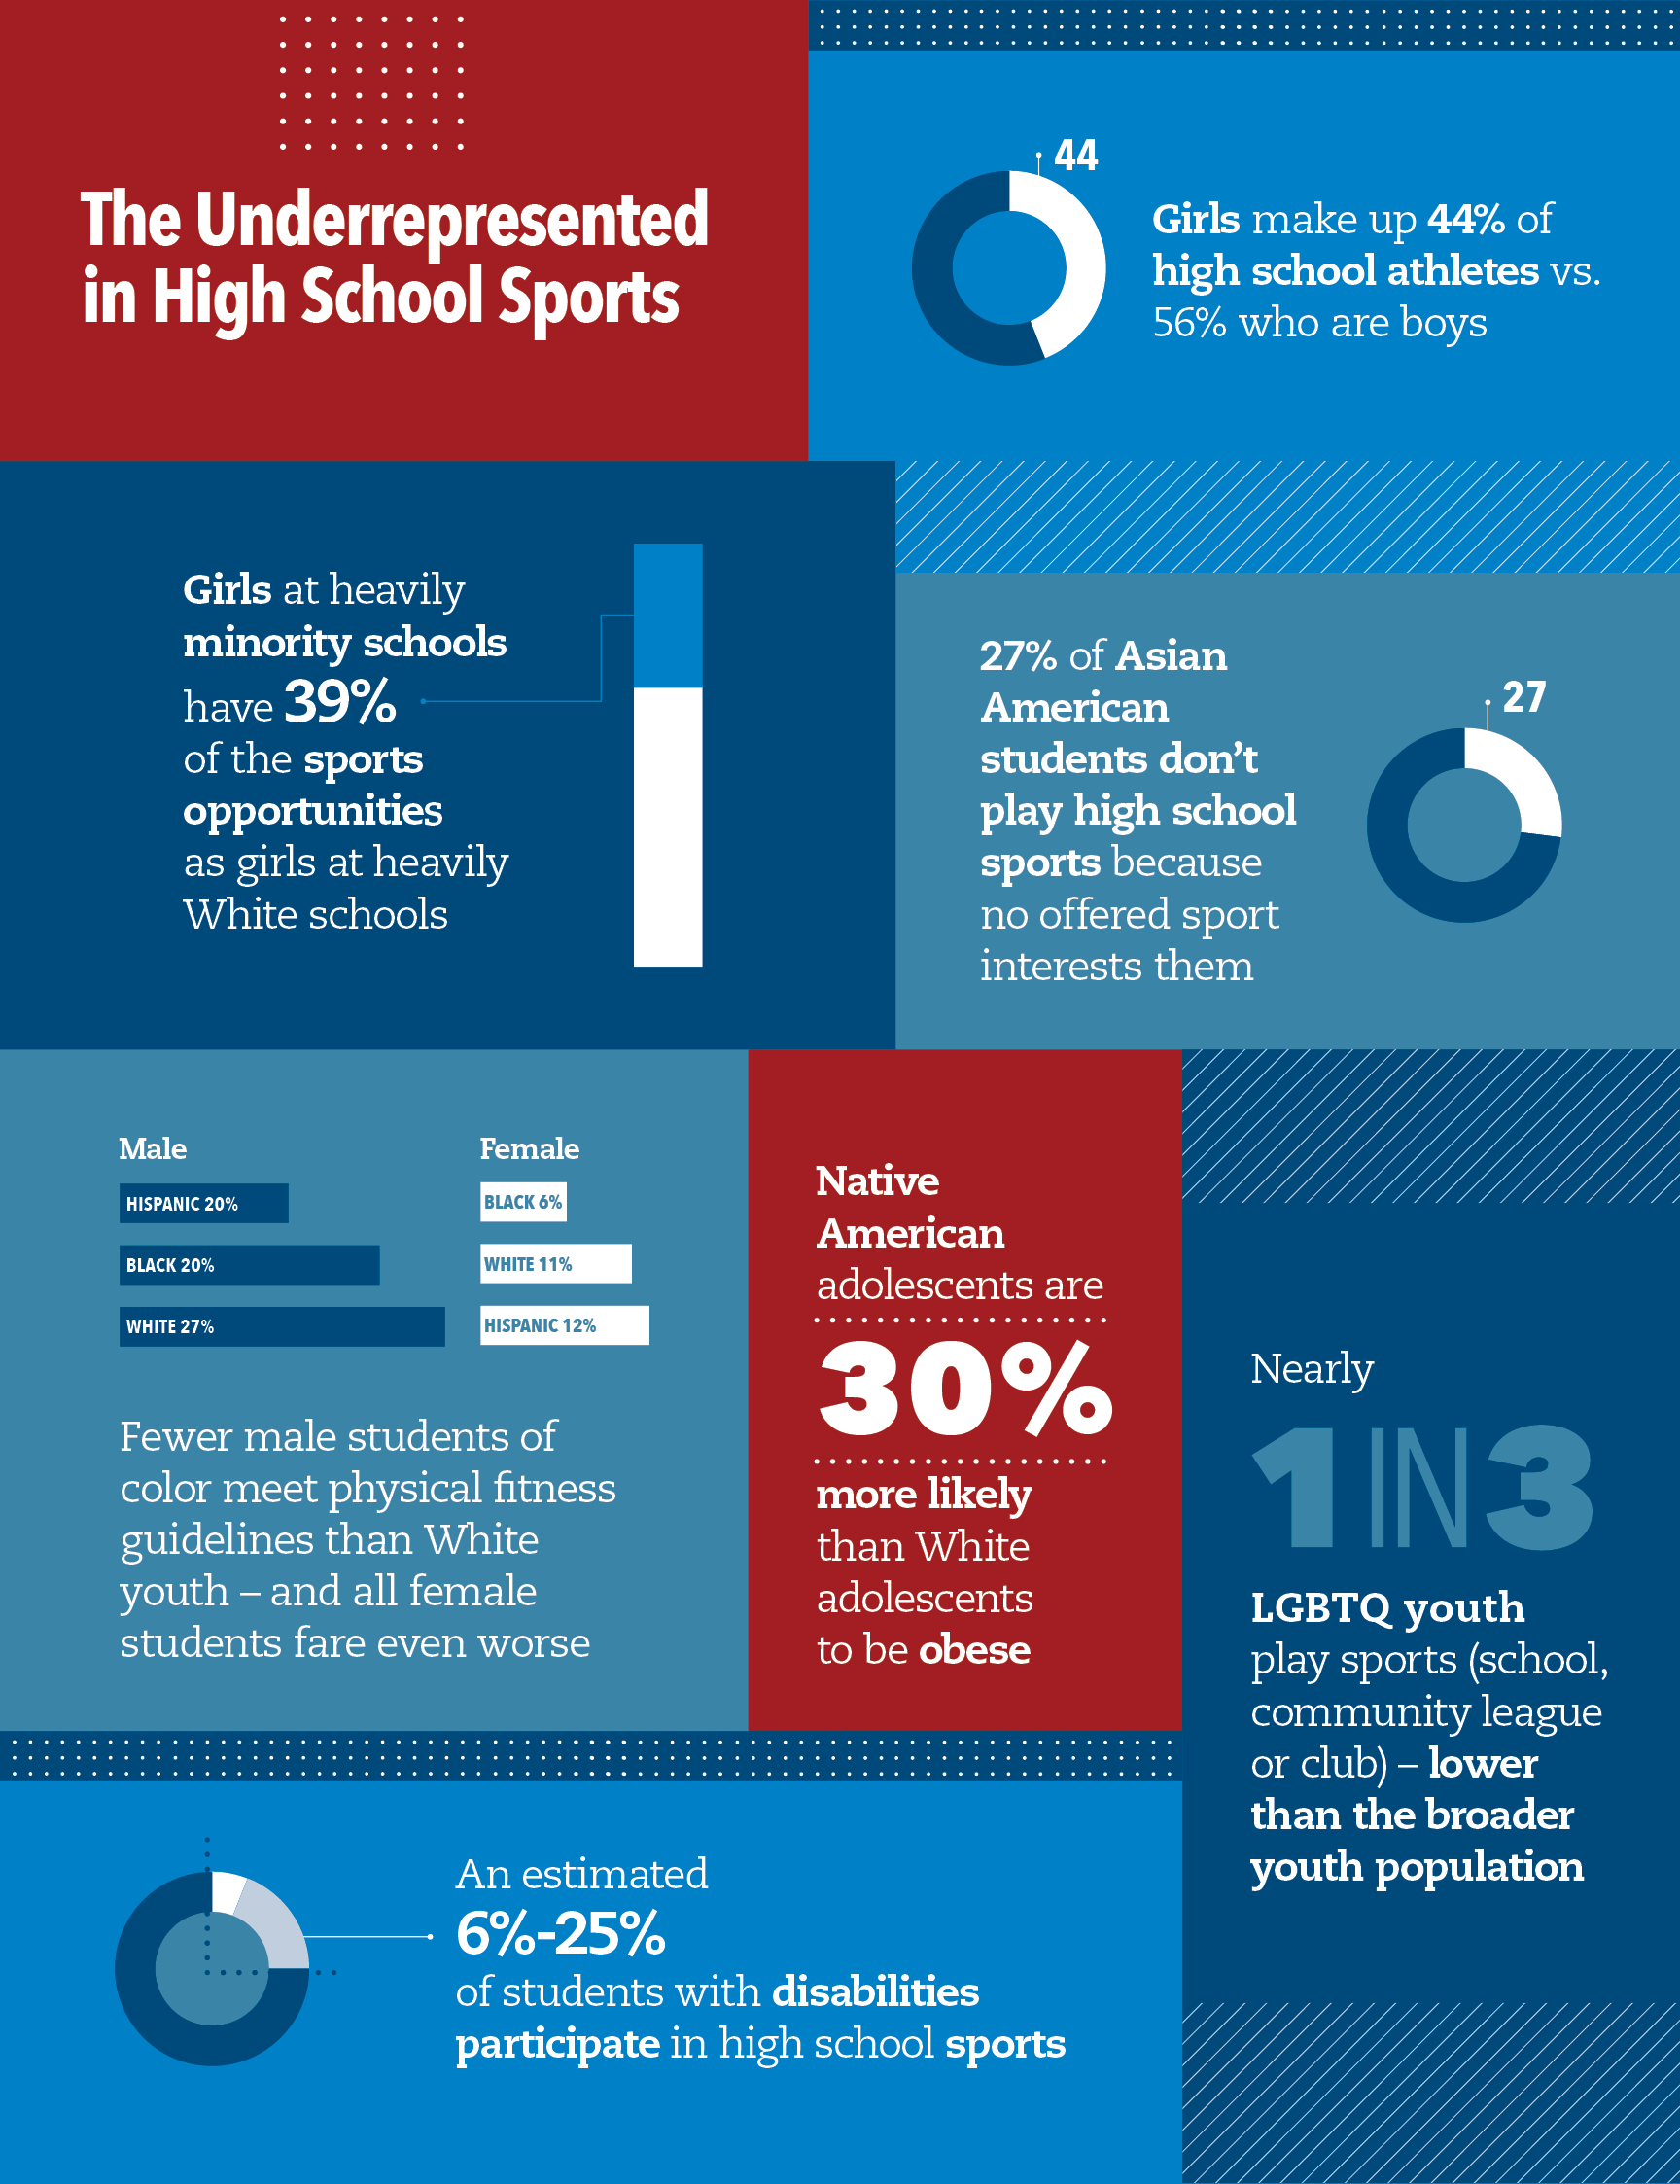
Access is also shaped by geography and gender. In "low socio-economic schools," those that serve the highest percentage of kids on free or reduced-price lunches, only 24.6% of eighth graders play sports. For "high socio-economic schools," it's 36.1%. Despite major gains among girls over the past four decades delivered by Title IX legislation and enforcement, in 2012, the participation rates for girls remained 2-5% lower than for boys (Bridging the Gap, RWJF, 2012). A 2015 study suggests that gap may be closer to 6% (RWJF/Harvard/NPR, 2015). As adults, the gender gap is more pronounced: 35% of men say they play sports, while only 16% of women say the same thing (RWJF/Harvard/NPR, 2015). In Washington, D.C., the percentage of athletic opportunities provided to public high school students has been as low as 15% for boys and 6% for girls (Women's Sports Foundation, 2011).
click to enlarge
Disparities exist by state and region, too. Data collected by the federal government show that North Dakota, New Hampshire and Connecticut have the highest rates of participation on sports teams among youth ages 6-17. Seven out of 10 youth play sports in those states. Most of the 10 states where less than half of youth played sports are in the South (Arizona, Florida, Georgia, Kentucky, Louisiana, Mississippi, New Mexico, Oklahoma, South Carolina, and Texas). (National Survey of Children’s Health, 2019)
Casual play
click to enlarge
Riding bikes caught on again during the pandemic. Bicycle sales soared during significant portions of the pandemic. Twelve percent of parents said their child tried riding a bicycle for the first time, with 10% of them expecting their child to continue with the activity (Project Play/Utah State University, 2021). Youth ages 13-17 regularly rode their bicycles 4% less in 2021 than 2020, and kids 6-12 had a 1% decline (Sports & Fitness Industry Association, 2021). Still, these were higher rates than pre-pandemic. Fringe sports activities that saw a pandemic-related bounce in participation began to see a regression to their average as more organized team sports returned.
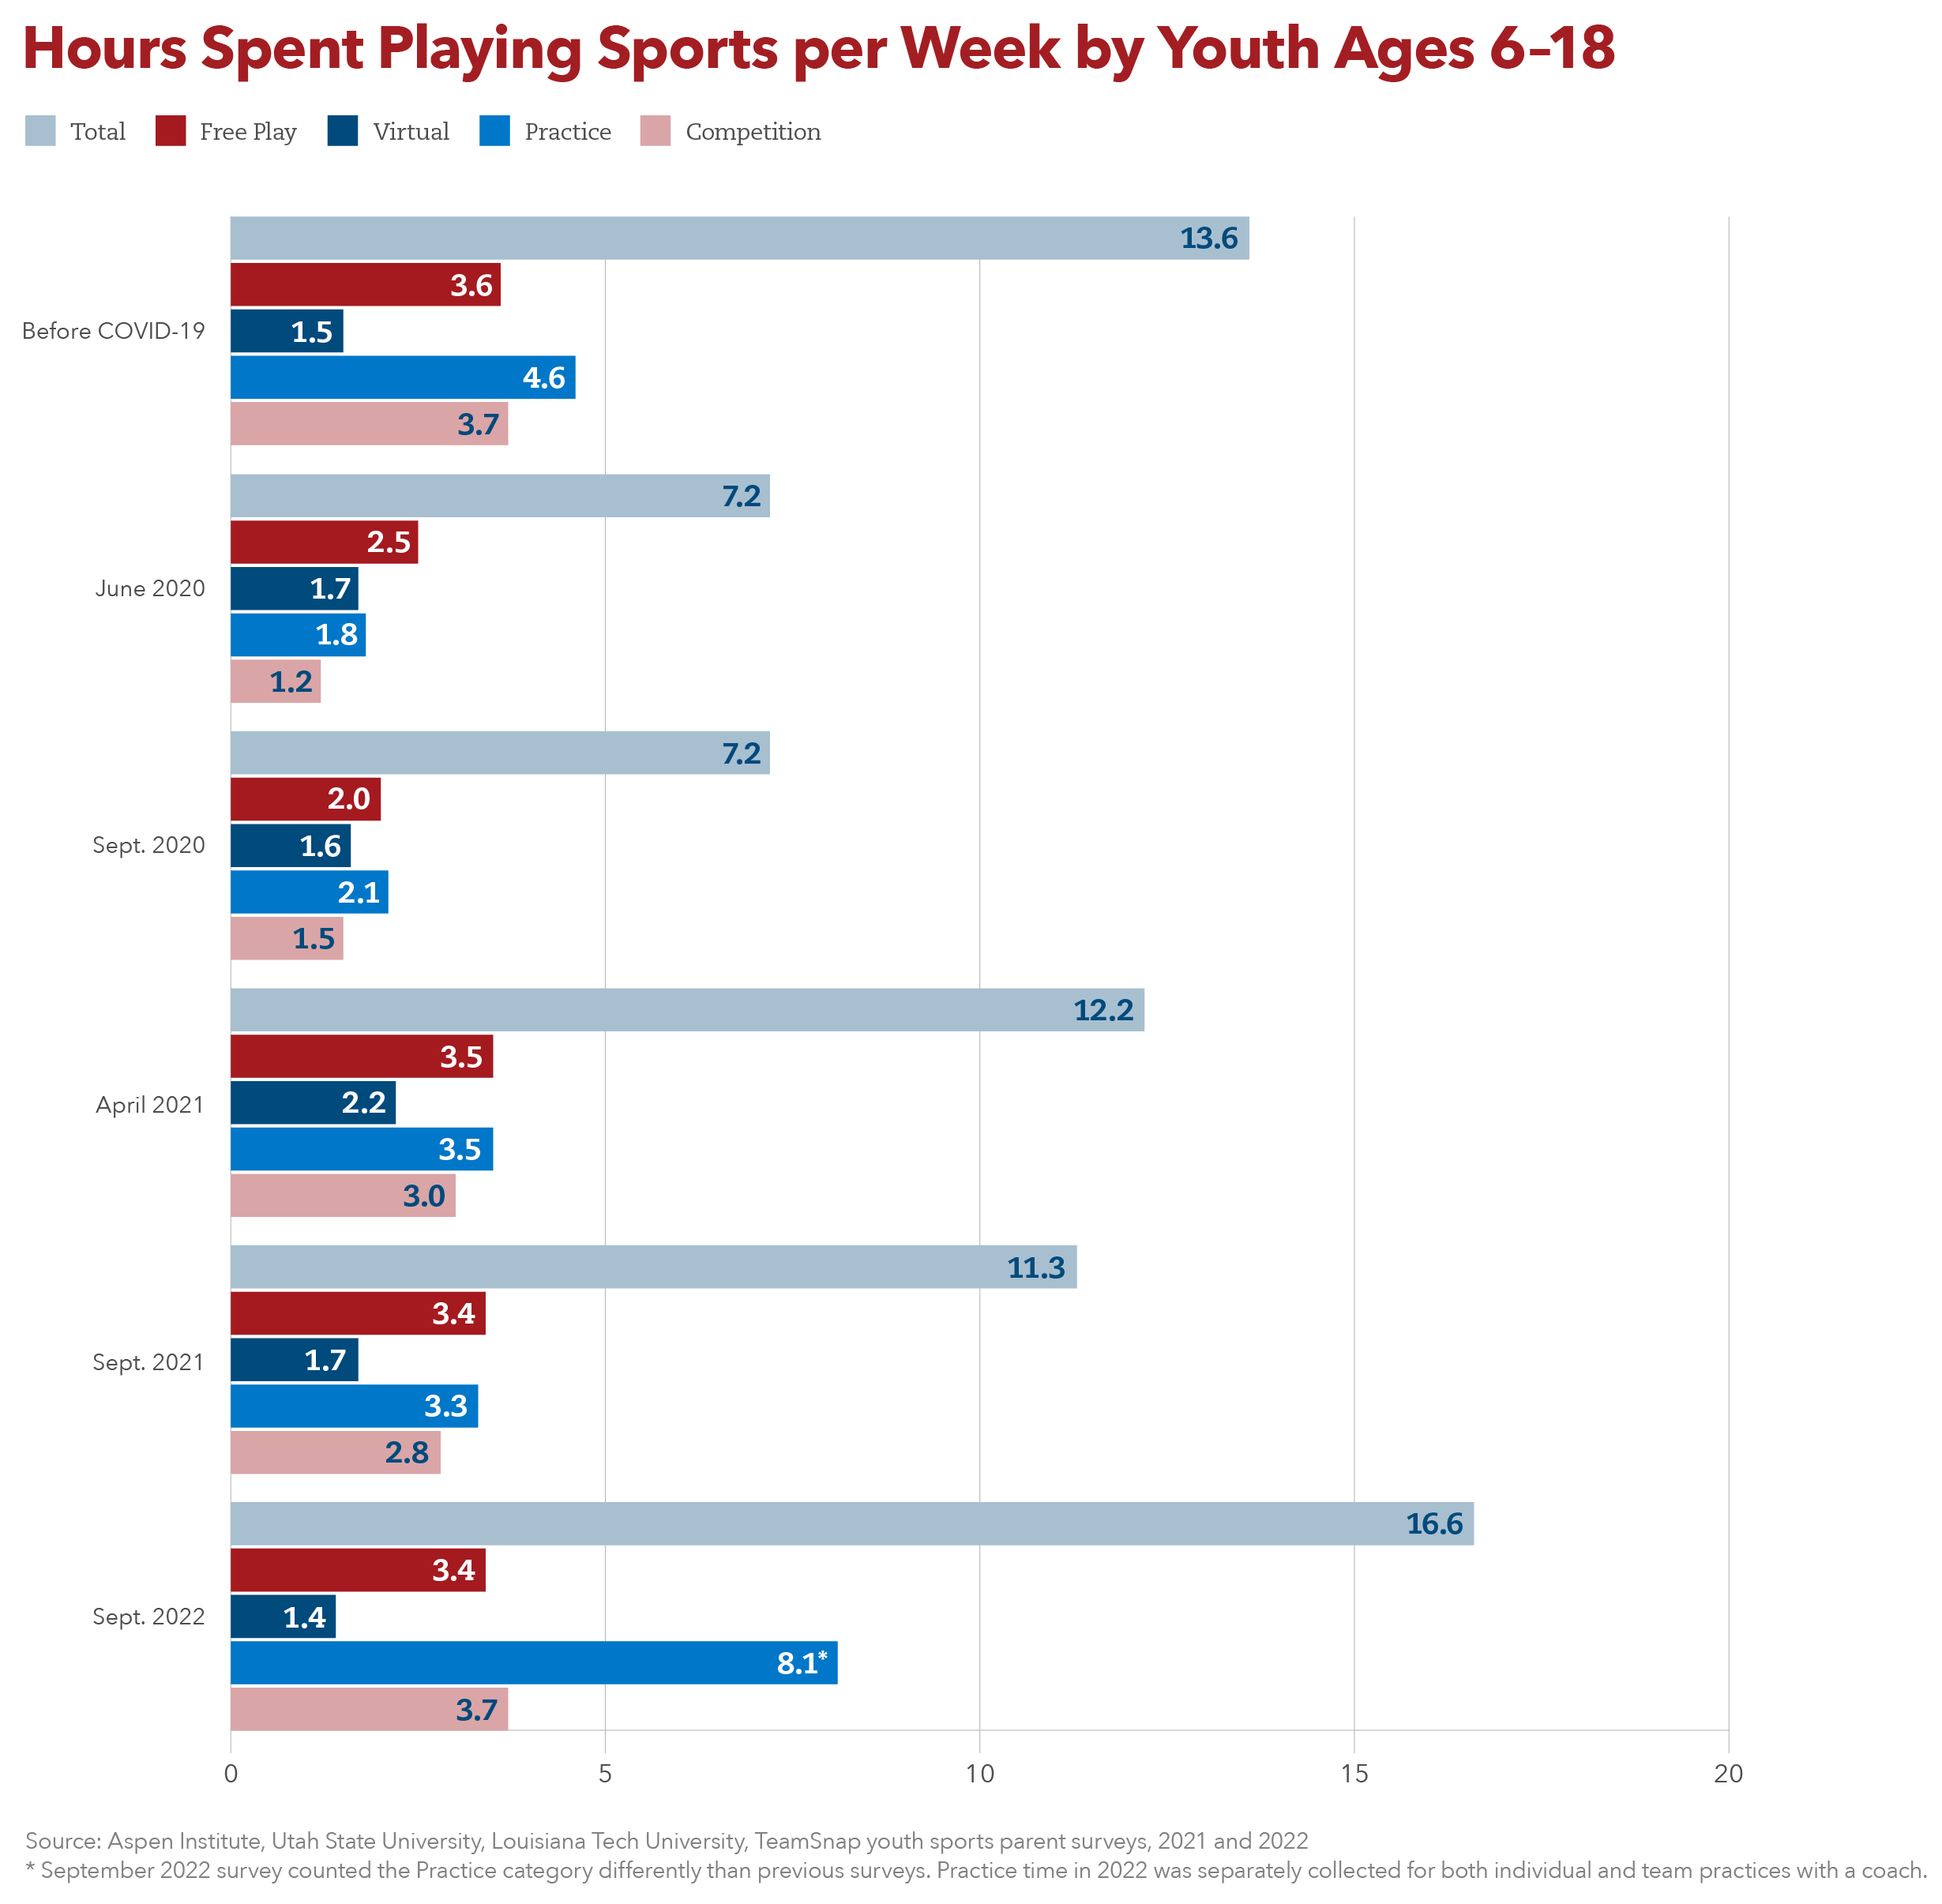
Fading is the era of sandlot or pickup ball, a form of play that organically promoted innovation and fitness among generations of Americans. More than 40% of parents whose child plays an organized sport say their child does so year-round (RWJF/Harvard/NPR, 2015). Yet free play has been shown to produce higher levels of physical activity than organized sports. One study found that 43% of youth sports practice was spent being inactive (Physical Activity During Youth Sport Practices, 2011). Free play is all but a thing of the past. The chart on the left shows how much more time youth spend on structured practices and competitions each week than unstructured play. In Fall 2022, children spent 3.4 hours weekly on free play, down 6% from before COVID-19.

Other responsibilities are keeping kids from playing. Nationally, high school students said schoolwork was the biggest reason they don’t play (Reimagining School Sports playbook, 2022). In the Aspen Institute’s community youth sports surveys, school was also listed as the No. 1 reason in Harlem (25% boys, 30% girls), in Mobile County, Alabama (28% boys, 29% girls), in Seattle–King County (46% boys, 50% girls) and in Hawai‘i (46% boys, 51% girls). Many children today have to work or take care of younger siblings.
There's a lack of mainstream options for the moderately interested athlete. In an Aspen Institute national survey, high school students said the supply of sport options provided by high schools is not meeting the demand for them, and the menu needs to be updated to include more casual and fitness-focused activities. When asked what additional physical activities outside of interscholastic teams that students would like to participate in, strength training (35%) was the No. 1 choice, followed by biking (24%), skateboarding (21%), yoga (21%) and climbing (20%). Males showed a higher interest in strength training and parkour, and females favored yoga and dance.
About 23% of middle schools and 40% of high schools do not offer intramural sports (Bridging the Gap, RWJF, 2012). In communities with fewer resources, sport options can be organized especially around the more motivated athletes and families. Parents from lower-income households are nearly twice as likely to say they hope their child will become a professional athlete as those from the higher-income homes (39% vs. 20%), according to the RWJF/Harvard/NPR survey.
Recreation spaces
Half of all vigorous exercise engaged in by Americans occurs in parks. People who live closer to parks report better mental health. Time spent in green outdoor spaces has been shown to boost focus and concentration, and kids with attention deficit hyperactivity disorder (ADHD) experience milder symptoms when they play outside in a natural setting. But in some cities as many as two-thirds of children are without access to a nearby park (The Trust for Public Land). The deficits are greatest in predominantly African American and Hispanic neighborhoods. For instance, only 64% of students in East Baltimore said there’s a safe place to play, according to a 2017 survey by the Aspen Institute. In a three-square-mile area of East Harlem, youth there told the Aspen Institute that the prevalence of drugs, alcohol and police activity on the playgrounds prevents them from having safe play spaces nearby. Just walking to safer play spaces can be a barrier.
Some good news: In 2021, the Land and Water Conservation Fund began to receive full, permanent funding for the first time – $900 million annually. State and local communities get 40% of that in matching grants to build and restore outdoor recreation facilities. The Department of Interior began distributing $150 million from that allocation for economically disadvantaged communities. Then there’s the river of federal aid tied to the pandemic. The American Rescue Plan includes $350 billion for state and local governments to address economic and social impacts, including investments in parks, trails and open spaces. (Read more in the Call for Leadership section of the State of Play 2021 report).
Also, major cities are investing more in parks. In the 2023 fiscal year, $11.2 billion was invested in city parks across the 100 most populous U.S. cities, up from $9.7 billion in 2022, according to Trust for Public Land. That’s the most since the pre-2007 Great Recession even after adjusting for inflation. The 100 most populous cities represent 20% of the U.S. population. A research report by Trust for Public Land found that civic and business leaders are investing in parks and open spaces to respond to pressing economic challenges. Local public park and recreation agencies in the U.S. generate more than $201 billion in economic activity and support almost 1.1 million jobs that boosted labor income by more than $63 billion from their operations and capital spending in 2021.
Injuries

Serious knee injury rates are increasing in high school sports. Tears of the anterior cruciate ligament (ACL), among the most devastating sports injuries and one that can carry physical and financial consequences into adulthood, increased 12% between 2007-08 and 2021-22, according to research by Hospital for Special Surgery (HSS) and the Datalys Center. Girls soccer had the highest rates, followed by tackle football, girls basketball, and girls lacrosse. Soccer will be a sport of focus for the new National ACL Injury Coalition, formed in 2023 by HSS and the Aspen Institute, since female high school players suffer the highest rates of ACL injury and male players trail only football and lacrosse.
Nearly nine out of 10 parents have concerns about risk of injury (87.9%), according to an espnW/Aspen Institute Project Play Survey of Parents on youth sports issues in 2014. Parents were more concerned about injuries than any other issue, including the quality or behavior of coaches (81.5%), cost (70.3%), the time commitment required (67.9%), and the emphasis on winning over having fun (66.1%). Read full results from the nationally representative survey.
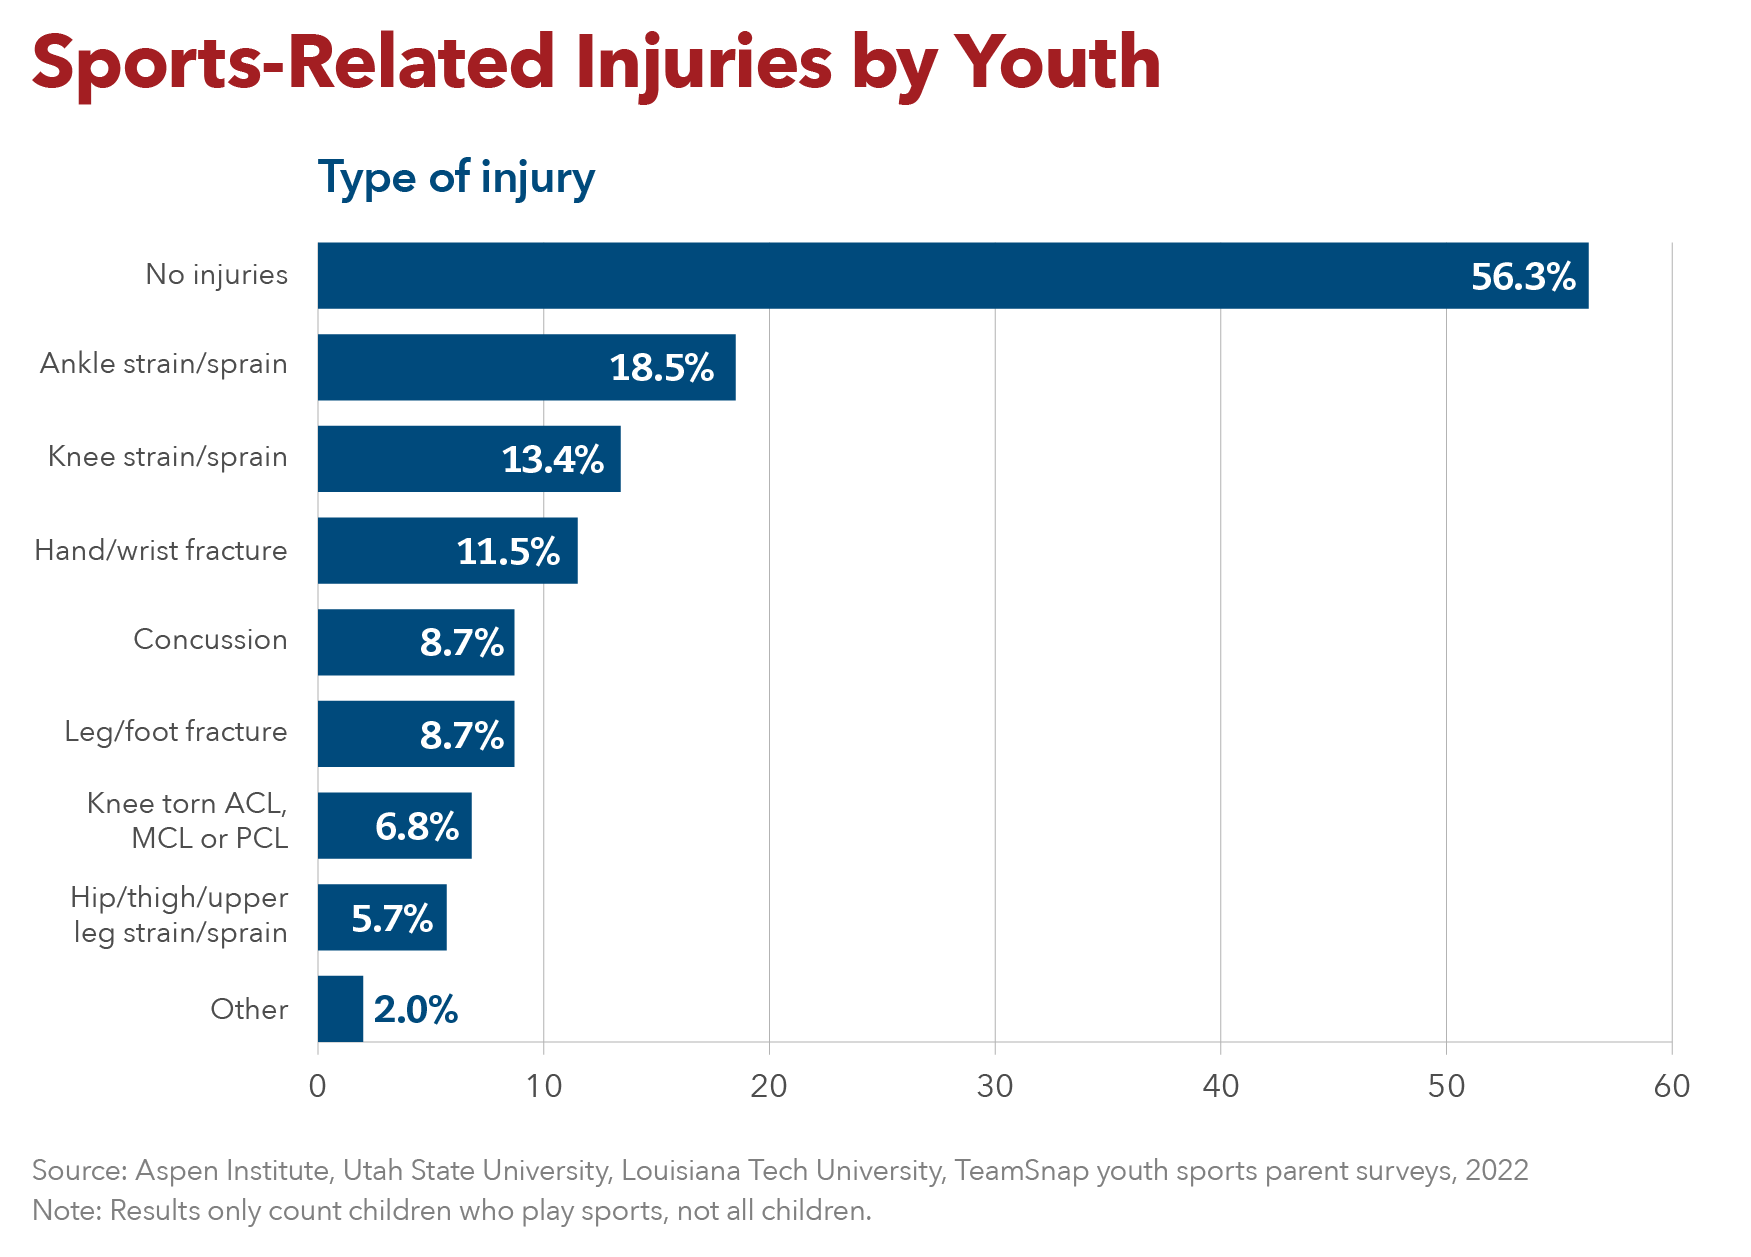
In a 2018 survey by the Hospital for Special Surgery and Aspen Institute, concussions ranked as the No. 1 injury concern for all parents. Parents with middle-class income, White parents, and parents with a post-college education were more likely to rank concussion as a top concern. Among all parents, the next biggest injury concerns were joint injuries, broken bones/sprains/strains, and overuse injuries.
Children have concerns about injuries, too. Our State of Play Oakland report found Latino/a (20%), Asian (17%) and Black (15%) youth don’t play sports due to injury fears at higher rates than White children (8%). Girls were almost twice as likely as boys to report these fears in Oakland. Fear of getting hurt was the No. 2 reason why children in Baltimore and Harlem said they don’t play sports; it was No. 3 for youth in Mobile County, Alabama, according to Aspen Institute surveys in 2017 and 2018. Read the Baltimore, Harlem and Mobile County reports.
More than 3.5 million children under age 14 receive medical treatment for sports injuries annually. According to the CDC, more than half of all sports injuries are preventable. Overuse injuries are responsible for nearly half of all sports injuries to middle and high school students (STOP Sports Injuries).
Specializing in sports early carry risks of higher injury rates, increased psychological stress, and quitting sports at a young age. For most sports, there is no evidence that intense training and specialization before puberty are necessary to achieve elite status, and specialization should be delayed until late adolescence. (Sports Specialization in Young Athletes: Evidence-Based Recommendations, 2013). A 2018 survey by the Aspen Institute and University of Texas showed that high school athletes on average began specializing in their primary sport as young as 10 (soccer, baseball, basketball and softball). Girls waited about two more years to start specializing in basketball than boys. High school athletes who played their primary sport 10 to 12 months per year scored significantly better on social, emotional and psychological elements than athletes who focused on their primary sport less, yet the year-round athletes reported worse negative experiences.
Untrained coaches
click to enlarge
More coaches have been trained at least once, but trainings are less frequent. Some good news: Far more coaches say they have been trained at least one time in their life in the key competencies tracked annually by the Sports & Fitness Industry Association. Between 83% and 90% of coaches surveyed in 2023 indicated being trained at least once in their life. In 2018, between 51% and 66% of coaches said yes to this question.
At the same time, a lower percentage of current coaches in 2023 reported having received training in the last 12 months compared to a one-year period in 2019. For instance, 29% of coaches in 2023 reported recent training in injury prevention, down from 34% in 2019.
It’s important to note that coach training rates don’t account for the quality of the instruction and whether it makes a difference. Behavior change comes from a feedback loop and the coaching field generally lacks accountability and people consistently coaching the coaches.
The value of trained coaches was established long ago by researchers, with one study (Smoll and Smith, 1992) finding that when coaches received training in skills and communicating effectively with kids, only 5% of children chose not to play the sport again. With untrained coaches, the attrition rate was 26%.

Coaches need and want more help addressing the mental health of players. Almost all coaches said they feel strongly about their ability to coach X’s and O’s, foster a positive environment, and promote good sportspersonship. However, there was less confidence to deal with the mental aspects of sports (National Coach Survey). Only 18% of coaches reported feeling highly confident in their ability to link athletes to mental health resources. This was coaches’ second least-confident behavior behind helping athletes navigate social media pressures. Very few coaches felt confident in identifying off-field stressors for athletes (19%) and referring athletes to support (18%).
Soccer and baseball youth coaches reported feeling less confident supporting their athletes’ mental health than coaches in other sports. Yet soccer coaches in particular expressed greater interest to be trained in areas related to mental health, performance anxiety, emotional regulation, and social-emotional learning than their peers. Less than half of baseball (45%) and soccer (41%) coaches said they feel “moderately or extremely prepared” to work with athletes struggling with mental health – a lower rate than basketball coaches (57%). Baseball and soccer coaches also feel less prepared to link athletes to mental health resources, help them navigate social media, and identify off-the-field stressors.
Coach training matters. Trained youth sports coaches report they are significantly more confident in their coaching behaviors than untrained coaches. This is particularly true for coaches trained in youth development strategies such as developing leaders, teaching life skills, and supporting mental health. According to the National Coach Survey, 91% of coaches trained in youth development reported having an impact on their athletes becoming role models in their communities vs. 77% of untrained coaches.
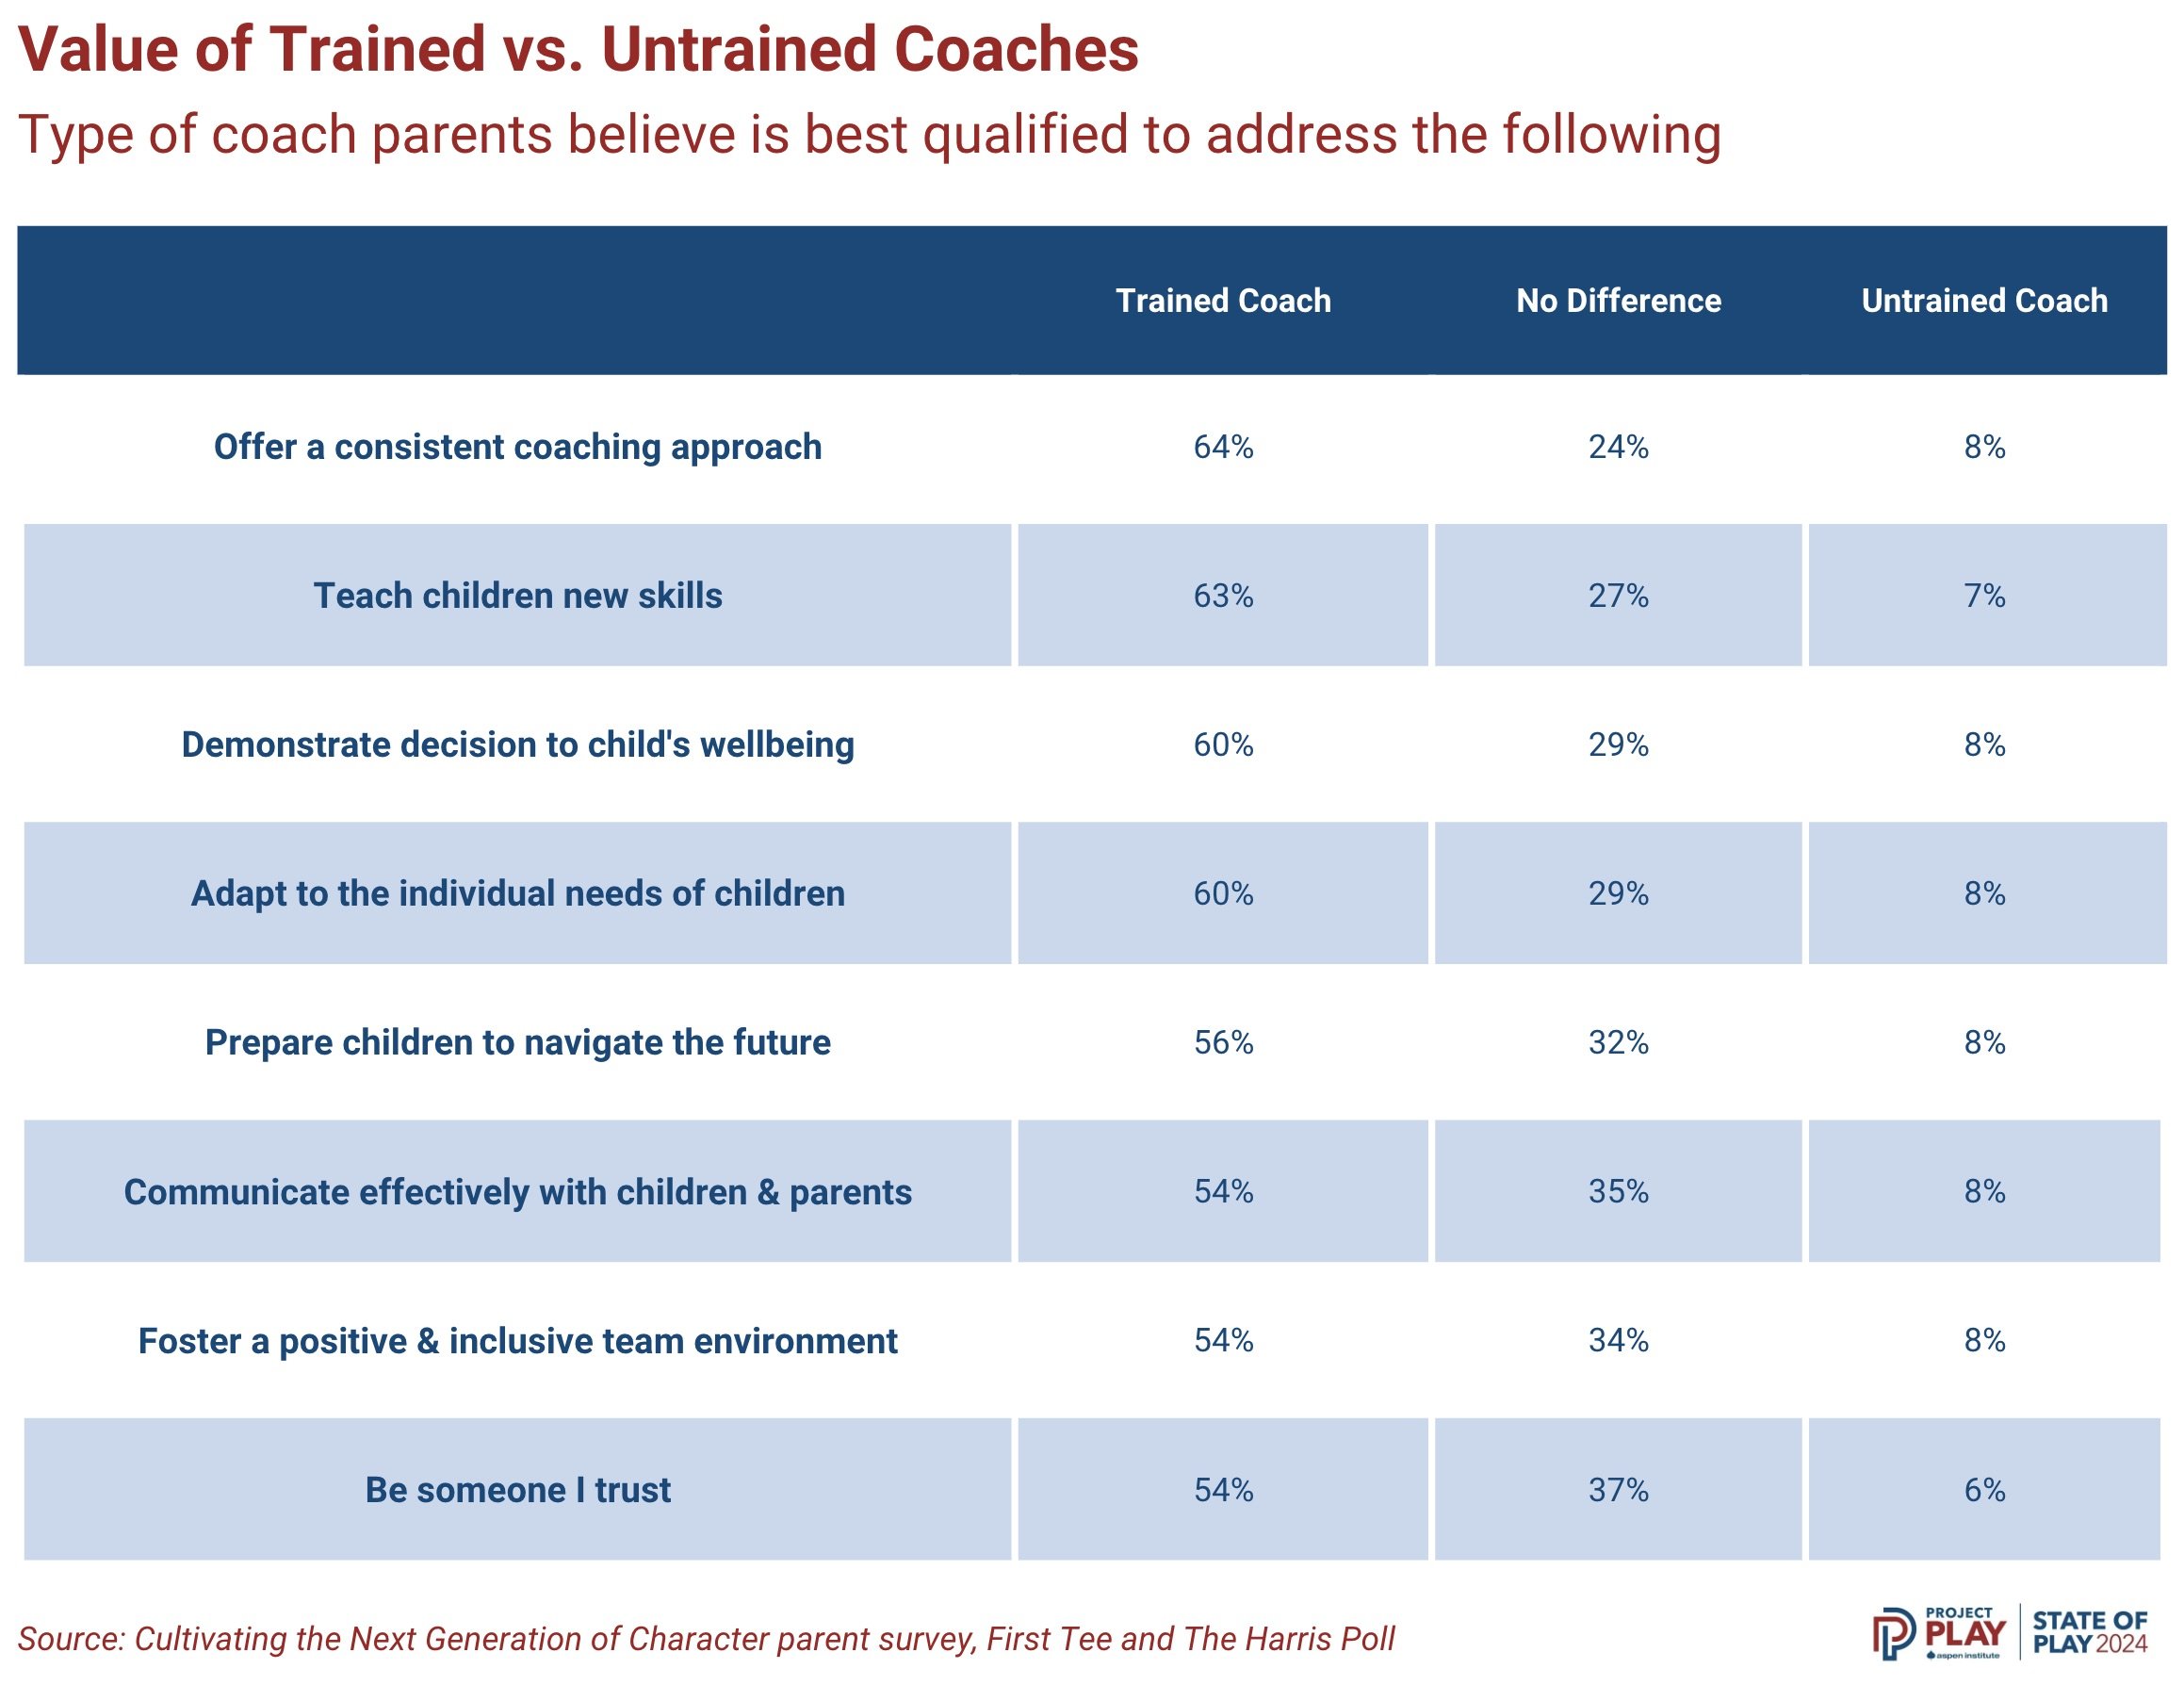
Parents value trustworthy and trained coaches. More than half of surveyed parents say that a trustworthy coach would increase their enthusiasm to commit their child long-term to the activity, recommend the activity to other parents, and enroll their child in more activities. This was a key takeaway from a report, “Cultivating the Next Generation of Character,” through a survey by First Tee and The Harris Poll. A higher percentage of Gen X parents (41%) — adults currently between the ages of 44 and 59 — would prioritize their child’s activity over other options if there was a trustworthy sports coach. And 34% of Gen X parents would pay a premium for trustworthy coaches, also a higher rate than other parents.
click to enlarge
Men continue to dominate youth coaching. Only 28% of youth sports head coaches in 2022 were female, according to data from SFIA. The lack of female coaches is occurring despite growth in female sports participation. Even in softball and volleyball, sports predominantly played by girls, about 4 of 10 youth coaches are men, according to analysis of the 2022 National Coach Survey. In both basketball and soccer, 81% of the coaches surveyed were men.
Men are twice as likely to coach the opposite gender as women. In the National Coach survey, 17% of men reported coaching female teams most often compared to 8% of women who coach male teams most frequently. This speaks to cultural factors and biases associated with women coaching males at all levels of sports – adding to the challenge of recruiting more female coaches.
In the National Coach Survey, 67% of male coaches said they were extremely likely to continue coaching vs. 60% of female coaches. The survey showed a higher rate of inexperienced coaches who are female – 36% of women had coached one to five years vs. 27% of men. Male coaches (48%) reported having coached more than 10 years as compared to women respondents (39%).
Older citizens have returned to help coach children. For about a decade and through the pandemic, adults ages 55 and older comprised a small portion of youth sports head coaches (about 14% to 20% of those who coach children ages 6-14). That’s changing. In two of the past three years, SFIA data shows this age group accounted for more than one-third of the coaches (37% in 2021 and 40% in 2023). The year in-between (2022) was a curious outlier at 19% of coaches who were 55 and older.
Technology
Children today often spend many hours in front of screens (mobile phones, computers, video games, TV), with products that have gotten better at getting and keeping their attention. Even for those who are playing sports, these sedentary hobbies are competing interests in getting kids active through sports, according to parents. More than one in three parents say it is a challenge to make sure their children get enough exercise (RWJF/Harvard School of Public Health, 2016). A Gallup poll found children ages 2 to 10 spend significantly less time engaged in free play than they do in front of screens (18 to 21 hours a week). Nearly all of the kids had more screen time than the number of hours per day recommended by the American Academy of Pediatrics.
Now, say hello to esports. It's young people watching other young people play video games – the latest success of the industry in giving kids what they want, and thus another potential competitor for kids’ attention. College scholarships now exist for esports. The National Association of Collegiate eSports has climbed to more than 30 member colleges, whose average scholarship payout is about $7,600 (Inside Higher Education, 2017). In 2018, the National Federation of State High School Associations began sponsoring esports, and five member state associations now stage esports state championships. There are now efforts by gaming leagues to identify video game players before middle school in order to compete with other countries (The Associated Press, 2018).
During the pandemic, half of youth sports parents said their child often or sometimes participated in esports or other organized video gaming during the past month (Project Play/Utah State University, 2021). That rate was even higher (66%) among parents who said their child had been inactive for a month. Meanwhile, 82% of parents said their child’s screen time “increased greatly” since the pandemic started, while organized sports (69%) and free play (59%) “decreased greatly” since March 2020 (TeamSnap/Utah State University, 2021).